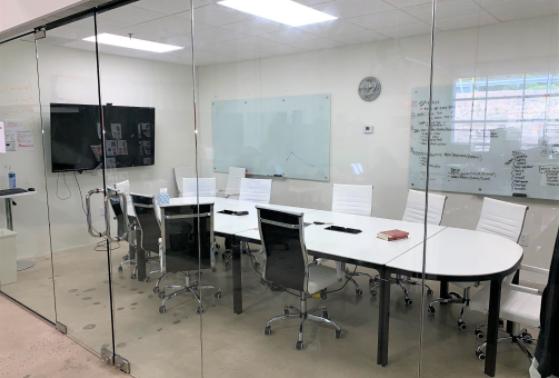
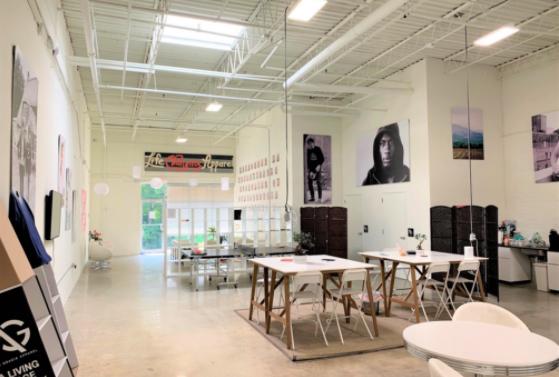
1-Mile | 3-Miles | 5-Miles | ||
---|---|---|---|---|
Total Population | 10,625 | 83,028 | 286,529 | |
Population Median Age | 34 | 35 | 36 | |
Population by Age | 0-9 Yrs | 1446 (13%) | 8626 (10%) | 25386 (8%) |
10-19 Yrs | 871 (8%) | 8167 (9%) | 30612 (10%) | |
20-29 Yrs | 2303 (21%) | 21634 (26%) | 70281 (24%) | |
30-39 Yrs | 2326 (21%) | 14662 (17%) | 50848 (17%) | |
40-49 Yrs | 1494 (14%) | 10319 (12%) | 35674 (12%) | |
50-59 Yrs | 1026 (9%) | 7995 (9%) | 30714 (10%) | |
60-69 Yrs | 602 (5%) | 5864 (7%) | 22033 (7%) | |
70+ Yrs | 558 (5%) | 5761 (6%) | 20982 (7%) | |
Median HH Income | $84,495 | $76,329 | $74,332 | |
Total Household Income | < 24K | 407 (8%) | 6206 (17%) | 23345 (18%) |
25-49K | 751 (15%) | 5956 (16%) | 21244 (16%) | |
50-74K | 1031 (20%) | 5603 (15%) | 20451 (15%) | |
75-99K | 717 (14%) | 3974 (11%) | 15138 (11%) | |
100-199K | 1189 (24%) | 7437 (20%) | 28398 (22%) | |
200K+ | 827 (16%) | 6777 (18%) | 20455 (15%) | |
Highest Education Level | No Diploma | 280 | 3093 | 11177 |
Diploma or GED | 644 | 6041 | 25329 | |
Some College | 732 | 7374 | 27079 | |
Assoc. Degree | 359 | 1927 | 8395 | |
Bachelors Degree | 3248 | 20732 | 70477 | |
Higher Degree | 2379 | 16879 | 55390 | |
Total Housing Units | 5,462 | 42,315 | 152,785 | |
--Owner-Occupied | 2,683 | 16,857 | 56,140 | |
--Renter-Occupied | 2,240 | 19,098 | 72,892 | |
Owner-Occupied Values | < 100K | 122 | 1017 | 4590 |
100-199K | 726 | 2677 | 9404 | |
200-299K | 599 | 2659 | 10166 | |
300-399K | 283 | 2045 | 6823 | |
400-499K | 205 | 1246 | 4917 | |
500K+ | 747 | 7212 | 20239 | |
Total Working Age Population | 8,684 | 70,370 | 248,880 | |
In Work Force | 6,891 | 47,451 | 169,979 | |
Not In Work Force | 1,793 | 22,919 | 78,901 | |
Workforce Employed | 6,704 | 45,420 | 162,098 | |
Workforce Unemployed | 142 | 1,948 | 7,648 | |
Civlian Workforce | 6,846 | 47,369 | 169,747 | |
Military Workforce | 45 | 82 | 232 | |
Total Households | 4,922 | 35,955 | 129,031 | |
Family Households | 2,162 | 15,023 | 49,774 | |
Non-Family Households | 2,760 | 20,932 | 79,257 | |
Married Couple | 1,598 | 11,524 | 35,450 | |
Other Family | 564 | 3,499 | 14,325 | |
Married w/Child | 828 | 5,143 | 13,159 | |
Single Male w/Child | 159 | 401 | 1,150 | |
Single Female w/Child | 188 | 1,581 | 6,346 |
Population Change Last Two Decades - Plus Projection
2000 | % | 2010 | % | 2020 | % | 2030 | |
---|---|---|---|---|---|---|---|
Georgia | 8,186,453 | +18 | 9,687,653 | +12 | 10,833,472 | +13 | 12,292,423 |
Cobb County | 607,751 | +13 | 688,078 | +15 | 790,588 | +19 | 938,747 |
DeKalb County | 665,865 | +4 | 691,893 | +15 | 793,154 | +19 | 944,045 |
Fulton County | 816,006 | +13 | 920,581 | +19 | 1,099,181 | +18 | 1,300,861 |
Total Working Age Population:
Total Households:
Total Working Age Population:
Total Households:
Total Working Age Population:
Total Households: