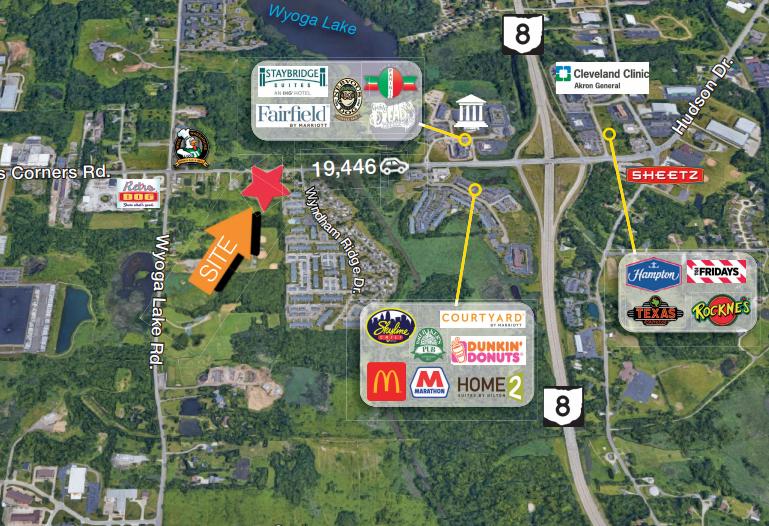
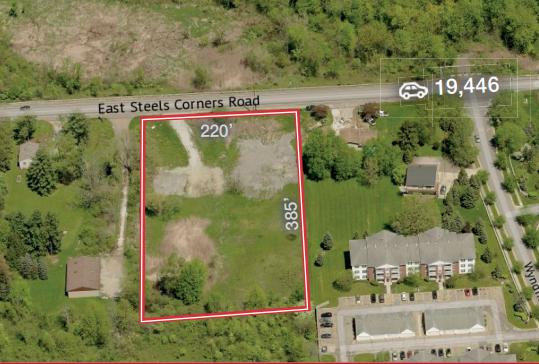
1-Mile | 3-Miles | 5-Miles | ||
---|---|---|---|---|
Total Population | 4,347 | 45,346 | 120,568 | |
Population Median Age | 37 | 41 | 40 | |
Population by Age | 0-9 Yrs | 595 (13%) | 4746 (10%) | 12828 (10%) |
10-19 Yrs | 319 (7%) | 5479 (12%) | 14218 (11%) | |
20-29 Yrs | 1171 (26%) | 6417 (14%) | 16826 (13%) | |
30-39 Yrs | 506 (11%) | 5751 (12%) | 16360 (13%) | |
40-49 Yrs | 405 (9%) | 5298 (11%) | 14651 (12%) | |
50-59 Yrs | 473 (10%) | 6183 (13%) | 16129 (13%) | |
60-69 Yrs | 386 (8%) | 5563 (12%) | 15057 (12%) | |
70+ Yrs | 492 (11%) | 5910 (13%) | 14500 (12%) | |
Median HH Income | $55,757 | $66,997 | $61,863 | |
Total Household Income | < 24K | 363 (17%) | 2881 (14%) | 8394 (16%) |
25-49K | 478 (23%) | 3940 (20%) | 12219 (23%) | |
50-74K | 465 (22%) | 3928 (20%) | 10028 (19%) | |
75-99K | 302 (14%) | 3027 (15%) | 7281 (14%) | |
100-199K | 370 (18%) | 4482 (23%) | 11075 (21%) | |
200K+ | 64 (3%) | 1026 (5%) | 2756 (5%) | |
Highest Education Level | No Diploma | 150 | 1519 | 5250 |
Diploma or GED | 680 | 8147 | 22109 | |
Some College | 492 | 6765 | 16851 | |
Assoc. Degree | 233 | 2911 | 7487 | |
Bachelors Degree | 774 | 8294 | 22424 | |
Higher Degree | 473 | 4665 | 12109 | |
Total Housing Units | 2,208 | 20,671 | 55,349 | |
--Owner-Occupied | 812 | 12,929 | 32,698 | |
--Renter-Occupied | 1,230 | 6,354 | 19,056 | |
Owner-Occupied Values | < 100K | 36 | 1826 | 6520 |
100-199K | 370 | 7011 | 15616 | |
200-299K | 317 | 2705 | 6694 | |
300-399K | 52 | 828 | 2314 | |
400-499K | 24 | 328 | 882 | |
500K+ | 14 | 230 | 672 | |
Total Working Age Population | 3,565 | 37,381 | 99,240 | |
In Work Force | 2,401 | 25,052 | 66,518 | |
Not In Work Force | 1,164 | 12,330 | 32,721 | |
Workforce Employed | 2,316 | 24,136 | 63,903 | |
Workforce Unemployed | 85 | 878 | 2,498 | |
Civlian Workforce | 2,401 | 25,015 | 66,401 | |
Military Workforce | 0 | 37 | 117 | |
Total Households | 2,043 | 19,283 | 51,754 | |
Family Households | 1,019 | 11,664 | 30,585 | |
Non-Family Households | 1,023 | 7,619 | 21,169 | |
Married Couple | 652 | 9,257 | 23,912 | |
Other Family | 367 | 2,407 | 6,674 | |
Married w/Child | 255 | 3,342 | 8,794 | |
Single Male w/Child | 29 | 340 | 876 | |
Single Female w/Child | 196 | 891 | 2,538 |
Population Change Last Two Decades - Plus Projection
2000 | % | 2010 | % | 2020 | % | 2030 | |
---|---|---|---|---|---|---|---|
Ohio | 11,353,140 | +2 | 11,536,504 | 0 | 11,574,870 | 0 | 11,615,100 |
Summit County | 542,899 | 0 | 541,781 | -1 | 534,150 | -1 | 528,990 |
Total Working Age Population:
Total Households:
Total Working Age Population:
Total Households:
Total Working Age Population:
Total Households: