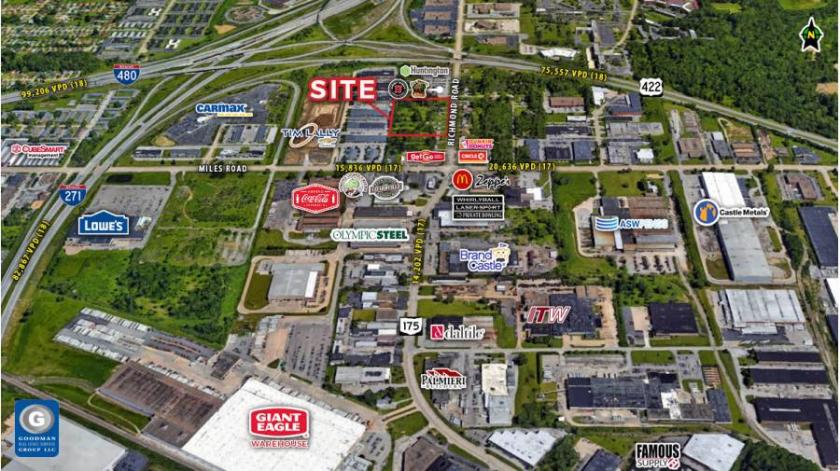
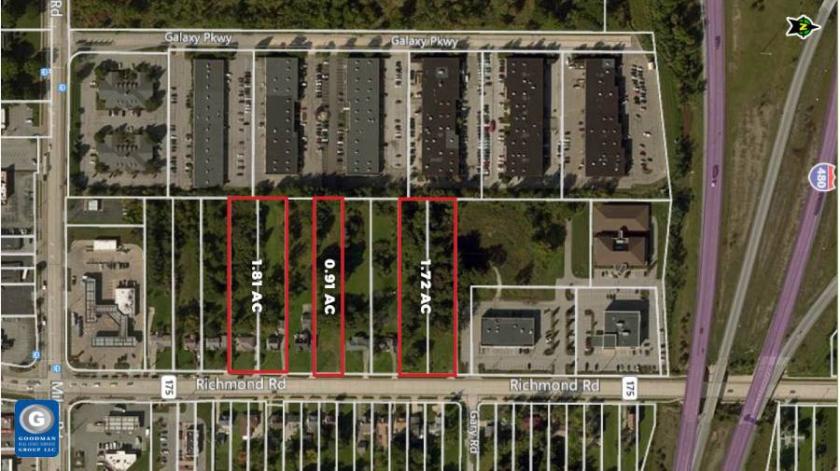
1-Mile | 3-Miles | 5-Miles | ||
---|---|---|---|---|
Total Population | 6,990 | 51,340 | 162,120 | |
Population Median Age | 39 | 41 | 41 | |
Population by Age | 0-9 Yrs | 998 (14%) | 6214 (12%) | 19589 (12%) |
10-19 Yrs | 719 (10%) | 5945 (11%) | 20727 (12%) | |
20-29 Yrs | 1056 (15%) | 6345 (12%) | 18292 (11%) | |
30-39 Yrs | 913 (13%) | 5606 (10%) | 18491 (11%) | |
40-49 Yrs | 711 (10%) | 6315 (12%) | 19390 (11%) | |
50-59 Yrs | 867 (12%) | 7180 (13%) | 22360 (13%) | |
60-69 Yrs | 911 (13%) | 6791 (13%) | 21031 (12%) | |
70+ Yrs | 814 (11%) | 6945 (13%) | 22239 (13%) | |
Median HH Income | $39,879 | $47,650 | $53,726 | |
Total Household Income | < 24K | 968 (27%) | 5615 (24%) | 15503 (22%) |
25-49K | 1224 (35%) | 6282 (27%) | 16427 (24%) | |
50-74K | 546 (15%) | 3951 (17%) | 11604 (17%) | |
75-99K | 433 (12%) | 2630 (11%) | 7390 (10%) | |
100-199K | 248 (7%) | 2969 (13%) | 10871 (15%) | |
200K+ | 63 (1%) | 1252 (5%) | 6153 (9%) | |
Highest Education Level | No Diploma | 350 | 2878 | 8766 |
Diploma or GED | 1521 | 10936 | 29768 | |
Some College | 1403 | 8903 | 24603 | |
Assoc. Degree | 664 | 3398 | 9392 | |
Bachelors Degree | 607 | 5147 | 19095 | |
Higher Degree | 299 | 4555 | 20858 | |
Total Housing Units | 3,966 | 25,409 | 76,687 | |
--Owner-Occupied | 1,121 | 11,896 | 42,099 | |
--Renter-Occupied | 2,361 | 10,804 | 25,847 | |
Owner-Occupied Values | < 100K | 645 | 5869 | 18958 |
100-199K | 324 | 2650 | 8525 | |
200-299K | 60 | 1240 | 5781 | |
300-399K | 32 | 873 | 3342 | |
400-499K | 18 | 665 | 2452 | |
500K+ | 41 | 599 | 3042 | |
Total Working Age Population | 5,635 | 41,671 | 130,276 | |
In Work Force | 3,799 | 25,543 | 81,253 | |
Not In Work Force | 1,837 | 16,128 | 49,023 | |
Workforce Employed | 3,368 | 23,572 | 74,885 | |
Workforce Unemployed | 431 | 1,964 | 6,328 | |
Civlian Workforce | 3,799 | 25,536 | 81,213 | |
Military Workforce | 0 | 8 | 40 | |
Total Households | 3,482 | 22,700 | 67,947 | |
Family Households | 1,812 | 13,163 | 41,278 | |
Non-Family Households | 1,670 | 9,537 | 26,669 | |
Married Couple | 642 | 7,006 | 25,229 | |
Other Family | 1,170 | 6,157 | 16,049 | |
Married w/Child | 136 | 2,302 | 9,166 | |
Single Male w/Child | 31 | 374 | 1,061 | |
Single Female w/Child | 601 | 2,579 | 6,496 |
Population Change Last Two Decades - Plus Projection
2000 | % | 2010 | % | 2020 | % | 2030 | |
---|---|---|---|---|---|---|---|
Ohio | 11,353,140 | +2 | 11,536,504 | 0 | 11,574,870 | 0 | 11,615,100 |
Cuyahoga County | 1,393,978 | -8 | 1,280,122 | -6 | 1,209,550 | -5 | 1,154,210 |
Total Working Age Population:
Total Households:
Total Working Age Population:
Total Households:
Total Working Age Population:
Total Households: