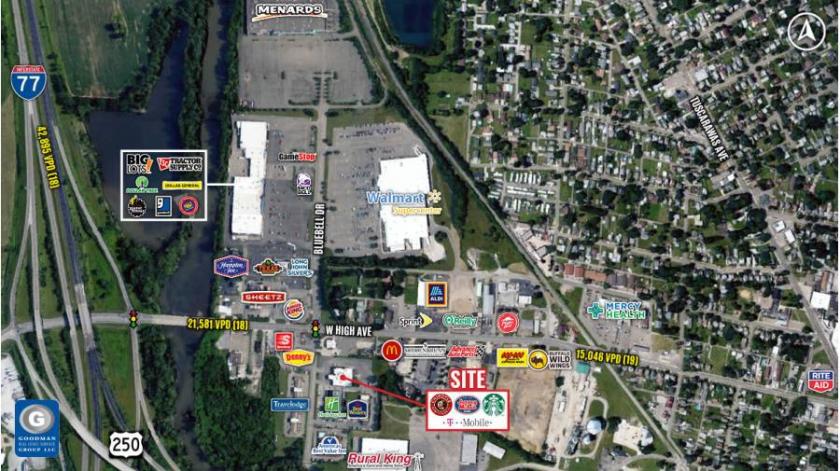
1-Mile | 3-Miles | 5-Miles | ||
---|---|---|---|---|
Total Population | 3,646 | 25,096 | 36,857 | |
Population Median Age | 43 | 40 | 41 | |
Population by Age | 0-9 Yrs | 389 (10%) | 3164 (12%) | 4317 (11%) |
10-19 Yrs | 323 (8%) | 3373 (13%) | 4755 (12%) | |
20-29 Yrs | 509 (13%) | 3109 (12%) | 4360 (11%) | |
30-39 Yrs | 445 (12%) | 3291 (13%) | 4640 (12%) | |
40-49 Yrs | 439 (12%) | 2880 (11%) | 4092 (11%) | |
50-59 Yrs | 588 (16%) | 2960 (11%) | 4580 (12%) | |
60-69 Yrs | 383 (10%) | 2921 (11%) | 4777 (12%) | |
70+ Yrs | 570 (15%) | 3399 (13%) | 5335 (14%) | |
Median HH Income | $38,006 | $45,546 | $50,892 | |
Total Household Income | < 24K | 551 (31%) | 2706 (25%) | 3527 (23%) |
25-49K | 466 (26%) | 2890 (27%) | 3928 (25%) | |
50-74K | 395 (22%) | 2123 (20%) | 3074 (20%) | |
75-99K | 212 (11%) | 1174 (11%) | 1856 (12%) | |
100-199K | 145 (8%) | 1278 (12%) | 2218 (14%) | |
200K+ | 1 (0%) | 241 (2%) | 558 (3%) | |
Highest Education Level | No Diploma | 507 | 2266 | 2987 |
Diploma or GED | 1179 | 6795 | 10294 | |
Some College | 439 | 3427 | 4784 | |
Assoc. Degree | 101 | 1041 | 1694 | |
Bachelors Degree | 315 | 2180 | 3533 | |
Higher Degree | 67 | 1159 | 2154 | |
Total Housing Units | 2,015 | 11,394 | 16,367 | |
--Owner-Occupied | 1,065 | 5,917 | 9,520 | |
--Renter-Occupied | 705 | 4,496 | 5,640 | |
Owner-Occupied Values | < 100K | 535 | 2039 | 2674 |
100-199K | 480 | 2875 | 4611 | |
200-299K | 47 | 666 | 1431 | |
300-399K | 2 | 150 | 425 | |
400-499K | 0 | 103 | 205 | |
500K+ | 0 | 83 | 173 | |
Total Working Age Population | 3,093 | 19,791 | 29,603 | |
In Work Force | 2,005 | 12,341 | 18,112 | |
Not In Work Force | 1,087 | 7,450 | 11,491 | |
Workforce Employed | 1,910 | 11,807 | 17,354 | |
Workforce Unemployed | 95 | 534 | 735 | |
Civlian Workforce | 2,005 | 12,341 | 18,089 | |
Military Workforce | 0 | 0 | 22 | |
Total Households | 1,770 | 10,413 | 15,160 | |
Family Households | 889 | 6,161 | 9,351 | |
Non-Family Households | 881 | 4,252 | 5,809 | |
Married Couple | 598 | 4,240 | 7,001 | |
Other Family | 291 | 1,921 | 2,350 | |
Married w/Child | 156 | 1,631 | 2,567 | |
Single Male w/Child | 42 | 258 | 288 | |
Single Female w/Child | 101 | 806 | 992 |
Population Change Last Two Decades - Plus Projection
2000 | % | 2010 | % | 2020 | % | 2030 | |
---|---|---|---|---|---|---|---|
Ohio | 11,353,140 | +2 | 11,536,504 | 0 | 11,574,870 | 0 | 11,615,100 |
Tuscarawas County | 90,914 | +2 | 92,582 | 0 | 92,310 | 0 | 91,890 |
Total Working Age Population:
Total Households:
Total Working Age Population:
Total Households:
Total Working Age Population:
Total Households: