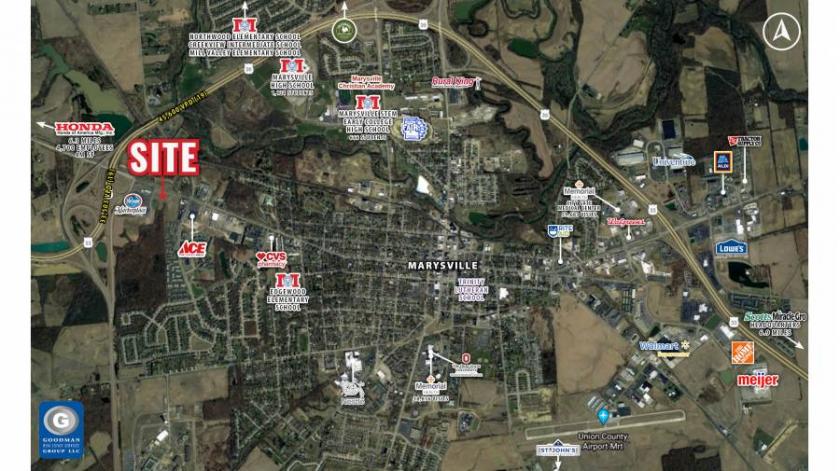
New 15,316-square-foot retail and restaurant development located at a signalized intersection
Anchored by Kroger Marketplace (one of Central Ohio’s top producing Krogers) Caters to Honda’s largest manufacturing facility in Ohio, Scotts Miracle-Gro Corporate Headquarters, Nestle, and Univenture
Honda: 4M SF manufacturing facility; 13th largest employer in Ohio
Scotts Miracle-Gro Headquarters: 923 employees
Univenture: 249 employees
Nestle: 230 employees
Located within 2.5 miles of Rural King, Walmart, Union County Airport, Union County Fairgrounds, Memorial Hospital, and City Gate Medical Center
Conveniently located one-quarter mile from US 33 with over 33,000 vehicles per day
Ideal for restaurants, convenience retail, and daily needs
No part of this information may be copied, reproduced, repurposed, or screen-captured for any commercial purpose without prior written authorization from MyEListing.
While we strive to provide the most accurate information, all listing information, and demographic data, is provided by third-parties. As such, MyEListing will not be responsible for the accuracy of the information. It is strongly recommended that you verify all information with the listing agent, and any relevant agencies, prior to making any decisions.
What is the building size of this commercial Retail property?
The size of this multi-unit property varies between 3946 - 15316 square feet
What kind of Retail is the propery at 1337 West 5th Street?
The property at 1337 West 5th Street Marysville, OH 43040 is listed as a Shopping Center Retail property
What is the population within 1 mile of 1337 West 5th Street in Marysville?
The population within 1 mile of 1337 West 5th Street Marysville, OH 43040 is 4,853 people.
Who do I contact for questions about 1337 West 5th Street?
You should contact the listing agent,
Daniel Clark, for any details regarding this commercial listing.