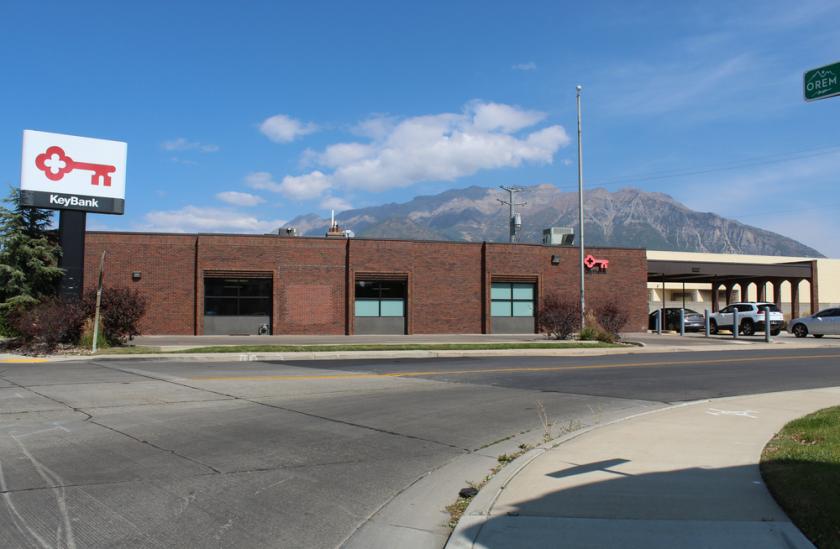
Retail Space
185 South State Street Orem, UT 84058
185 South State Street Orem, UT 84058

Details & Description
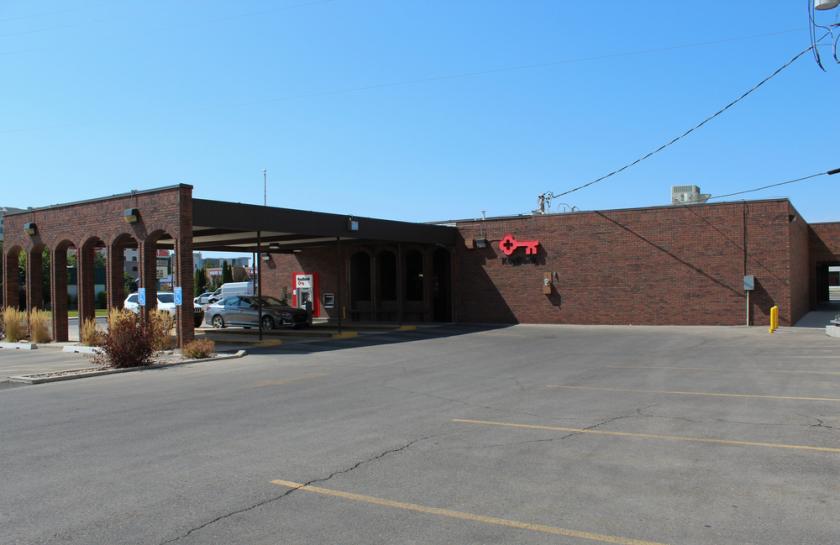
Additional Photos


Listing Agents

Ryan Edwards
O: 801-658-4482
M: 480-760-5044
ryan.edwards@svn.com
O: 801-658-4482
M: 480-760-5044
ryan.edwards@svn.com

Hayden Houston
O: 801-508-2881
M: 512-962-0316
hayden.houston@svn.com
O: 801-508-2881
M: 512-962-0316
hayden.houston@svn.com
While we strive to provide the most accurate information, all listing information, and demographic data, is provided by third-parties. As such, MyEListing will not be responsible for the accuracy of the information. It is strongly recommended that you verify all information with the listing agent, and any relevant agencies, prior to making any decisions.


