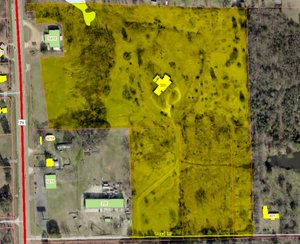
1-Mile | 3-Miles | 5-Miles | ||
---|---|---|---|---|
Total Population | 3,282 | 25,908 | 58,318 | |
Population Median Age | 35 | 37 | 38 | |
Population by Age | 0-9 Yrs | 571 (17%) | 3980 (15%) | 8319 (14%) |
10-19 Yrs | 372 (11%) | 3184 (12%) | 7477 (12%) | |
20-29 Yrs | 493 (15%) | 4011 (15%) | 8360 (14%) | |
30-39 Yrs | 668 (20%) | 3407 (13%) | 8142 (13%) | |
40-49 Yrs | 279 (8%) | 2681 (10%) | 6520 (11%) | |
50-59 Yrs | 293 (8%) | 3154 (12%) | 7130 (12%) | |
60-69 Yrs | 308 (9%) | 2734 (10%) | 6340 (10%) | |
70+ Yrs | 298 (9%) | 2757 (10%) | 6028 (10%) | |
Median HH Income | $55,580 | $46,113 | $45,886 | |
Total Household Income | < 24K | 213 (17%) | 2833 (27%) | 6368 (29%) |
25-49K | 320 (26%) | 2736 (26%) | 5287 (24%) | |
50-74K | 229 (19%) | 1625 (15%) | 3730 (17%) | |
75-99K | 135 (11%) | 966 (9%) | 2176 (9%) | |
100-199K | 260 (21%) | 1741 (17%) | 3326 (15%) | |
200K+ | 30 (2%) | 312 (3%) | 878 (4%) | |
Highest Education Level | No Diploma | 80 | 1632 | 4158 |
Diploma or GED | 661 | 5178 | 12318 | |
Some College | 579 | 4545 | 10406 | |
Assoc. Degree | 282 | 1598 | 3296 | |
Bachelors Degree | 309 | 2577 | 5490 | |
Higher Degree | 213 | 1429 | 2915 | |
Total Housing Units | 1,258 | 11,475 | 25,387 | |
--Owner-Occupied | 758 | 5,572 | 12,090 | |
--Renter-Occupied | 430 | 4,640 | 9,676 | |
Owner-Occupied Values | < 100K | 167 | 1904 | 4497 |
100-199K | 461 | 2596 | 4911 | |
200-299K | 125 | 795 | 1750 | |
300-399K | 3 | 156 | 437 | |
400-499K | 0 | 30 | 179 | |
500K+ | 2 | 92 | 316 | |
Total Working Age Population | 2,422 | 19,655 | 45,041 | |
In Work Force | 1,584 | 11,770 | 25,110 | |
Not In Work Force | 838 | 7,885 | 19,931 | |
Workforce Employed | 1,540 | 11,141 | 23,547 | |
Workforce Unemployed | 44 | 629 | 1,561 | |
Civlian Workforce | 1,584 | 11,770 | 25,109 | |
Military Workforce | 0 | 0 | 1 | |
Total Households | 1,188 | 10,211 | 21,766 | |
Family Households | 884 | 6,707 | 14,226 | |
Non-Family Households | 304 | 3,504 | 7,540 | |
Married Couple | 622 | 4,272 | 8,671 | |
Other Family | 262 | 2,435 | 5,556 | |
Married w/Child | 277 | 1,730 | 3,389 | |
Single Male w/Child | 20 | 289 | 597 | |
Single Female w/Child | 148 | 1,236 | 2,562 |
Population Change Last Two Decades - Plus Projection
2000 | % | 2010 | % | 2020 | % | 2030 | |
---|---|---|---|---|---|---|---|
Arkansas | 2,673,400 | +9 | 2,915,918 | +5 | 3,072,430 | +6 | 3,271,344 |
Miller County | 40,443 | +7 | 43,462 | +3 | 44,623 | +4 | 46,397 |
Texas | 20,851,820 | +21 | 25,145,561 | +18 | 29,677,668 | +18 | 34,894,452 |
Bowie County | 89,306 | +4 | 92,565 | 0 | 92,570 | -1 | 91,745 |
Total Working Age Population:
Total Households:
Total Working Age Population:
Total Households:
Total Working Age Population:
Total Households: