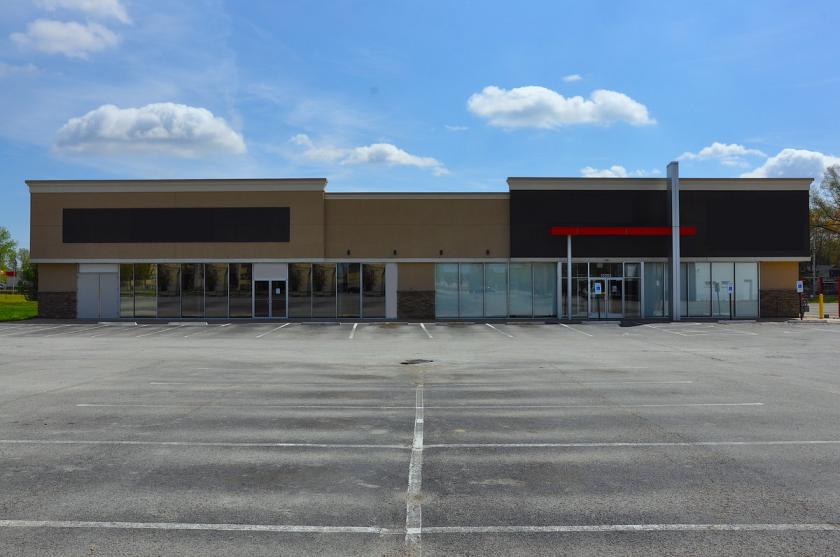
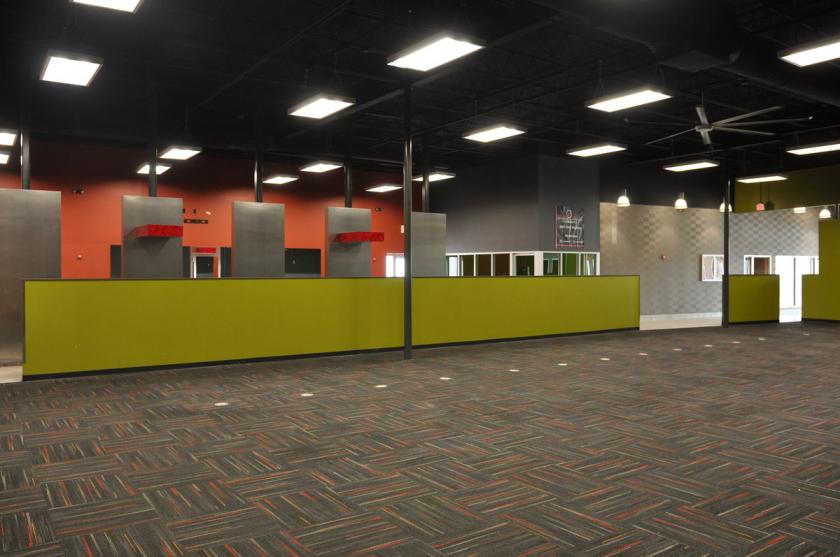
Retail Space
10205 Dixie Highway Louisville, KY 40272
10205 Dixie Highway Louisville, KY 40272
Details & Description
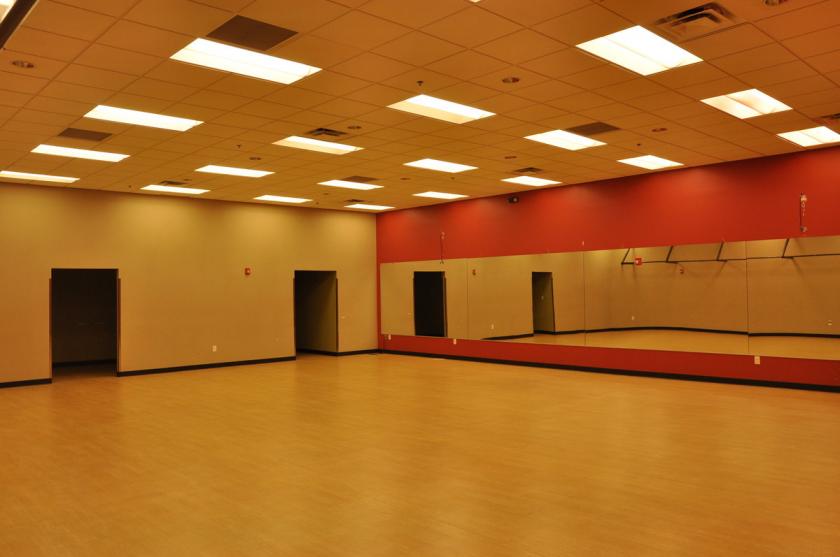
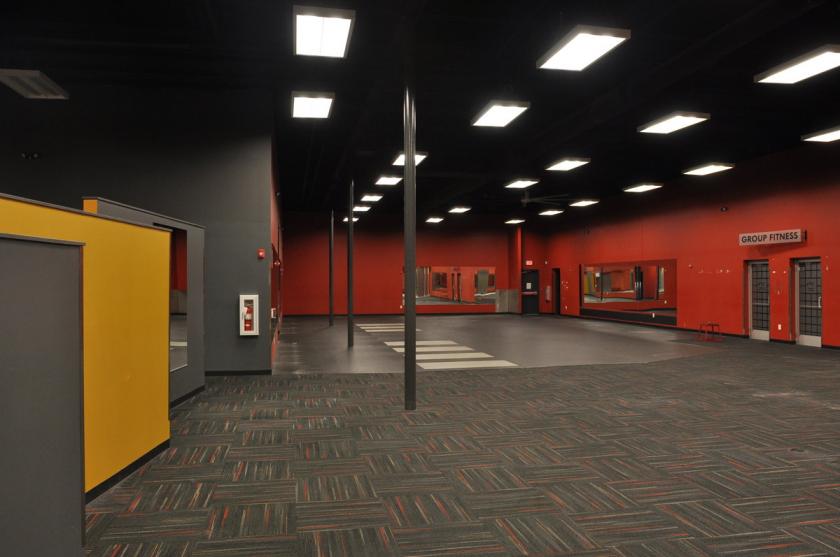
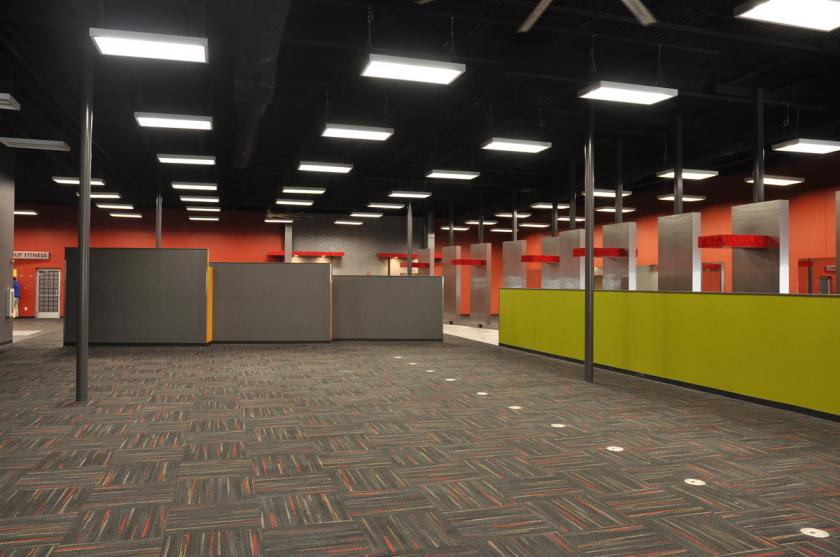
Additional Photos
Listing Agents

Wallace Fluhr
O: 502-777-6006
wfluhr@ccim.net
O: 502-777-6006
wfluhr@ccim.net
While we strive to provide the most accurate information, all listing information, and demographic data, is provided by third-parties. As such, MyEListing will not be responsible for the accuracy of the information. It is strongly recommended that you verify all information with the listing agent, and any relevant agencies, prior to making any decisions.


