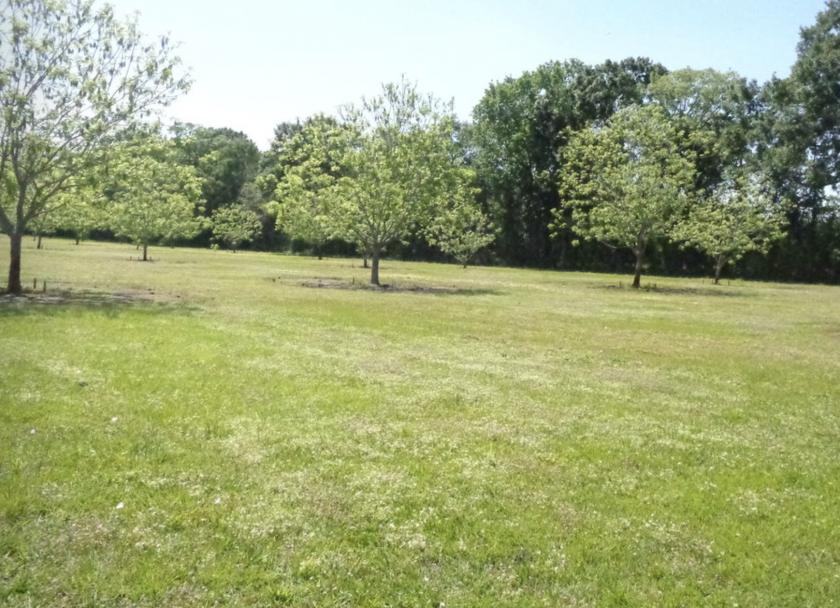
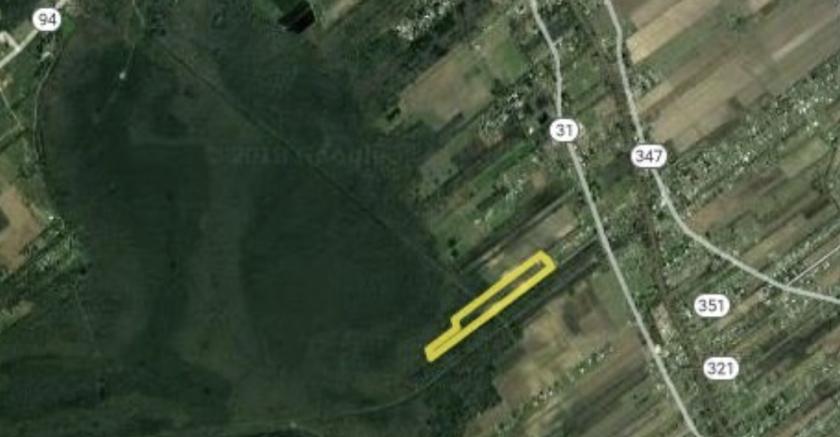
1-Mile | 3-Miles | 5-Miles | ||
---|---|---|---|---|
Total Population | 1,031 | 8,963 | 22,587 | |
Population Median Age | 35 | 36 | 36 | |
Population by Age | 0-9 Yrs | 204 (19%) | 1590 (17%) | 3545 (15%) |
10-19 Yrs | 127 (12%) | 1066 (11%) | 3095 (13%) | |
20-29 Yrs | 170 (16%) | 1330 (14%) | 3172 (14%) | |
30-39 Yrs | 116 (11%) | 1131 (12%) | 2818 (12%) | |
40-49 Yrs | 96 (9%) | 1067 (11%) | 2664 (11%) | |
50-59 Yrs | 117 (11%) | 1038 (11%) | 3036 (13%) | |
60-69 Yrs | 116 (11%) | 967 (10%) | 2514 (11%) | |
70+ Yrs | 84 (8%) | 774 (8%) | 1745 (7%) | |
Median HH Income | $47,108 | $45,384 | $49,616 | |
Total Household Income | < 24K | 96 (28%) | 845 (27%) | 2090 (26%) |
25-49K | 82 (24%) | 791 (25%) | 1834 (23%) | |
50-74K | 40 (11%) | 415 (13%) | 1125 (14%) | |
75-99K | 62 (18%) | 432 (13%) | 1129 (14%) | |
100-199K | 47 (13%) | 493 (15%) | 1298 (16%) | |
200K+ | 14 (4%) | 123 (3%) | 324 (4%) | |
Highest Education Level | No Diploma | 85 | 919 | 2311 |
Diploma or GED | 308 | 2680 | 6122 | |
Some College | 109 | 985 | 2827 | |
Assoc. Degree | 31 | 290 | 733 | |
Bachelors Degree | 79 | 611 | 1780 | |
Higher Degree | 25 | 173 | 628 | |
Total Housing Units | 392 | 3,661 | 9,005 | |
--Owner-Occupied | 275 | 2,388 | 6,072 | |
--Renter-Occupied | 66 | 712 | 1,727 | |
Owner-Occupied Values | < 100K | 110 | 895 | 2259 |
100-199K | 106 | 908 | 2097 | |
200-299K | 34 | 334 | 831 | |
300-399K | 4 | 77 | 403 | |
400-499K | 6 | 73 | 257 | |
500K+ | 13 | 101 | 226 | |
Total Working Age Population | 736 | 6,607 | 16,944 | |
In Work Force | 422 | 3,996 | 10,111 | |
Not In Work Force | 314 | 2,611 | 6,833 | |
Workforce Employed | 380 | 3,630 | 9,331 | |
Workforce Unemployed | 43 | 366 | 778 | |
Civlian Workforce | 422 | 3,996 | 10,109 | |
Military Workforce | 0 | 0 | 2 | |
Total Households | 341 | 3,100 | 7,799 | |
Family Households | 244 | 2,213 | 5,790 | |
Non-Family Households | 97 | 887 | 2,009 | |
Married Couple | 160 | 1,530 | 3,953 | |
Other Family | 84 | 683 | 1,837 | |
Married w/Child | 57 | 588 | 1,611 | |
Single Male w/Child | 6 | 57 | 167 | |
Single Female w/Child | 38 | 379 | 916 |
Population Change Last Two Decades - Plus Projection
2000 | % | 2010 | % | 2020 | % | 2030 | |
---|---|---|---|---|---|---|---|
Louisiana | 4,468,976 | +1 | 4,533,372 | +1 | 4,588,310 | +5 | 4,813,420 |
Lafayette Parish | 190,503 | +16 | 221,578 | -2 | 216,520 | +2 | 221,600 |
St. Landry Parish | 87,700 | -5 | 83,384 | +15 | 95,890 | +2 | 98,080 |
St. Martin Parish | 48,583 | +7 | 52,160 | +6 | 55,520 | +3 | 57,000 |
Total Working Age Population:
Total Households:
Total Working Age Population:
Total Households:
Total Working Age Population:
Total Households: