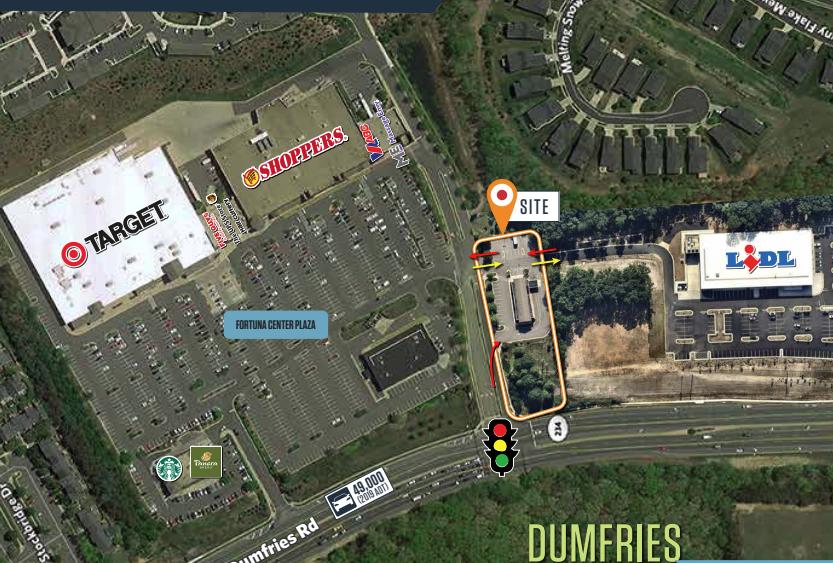
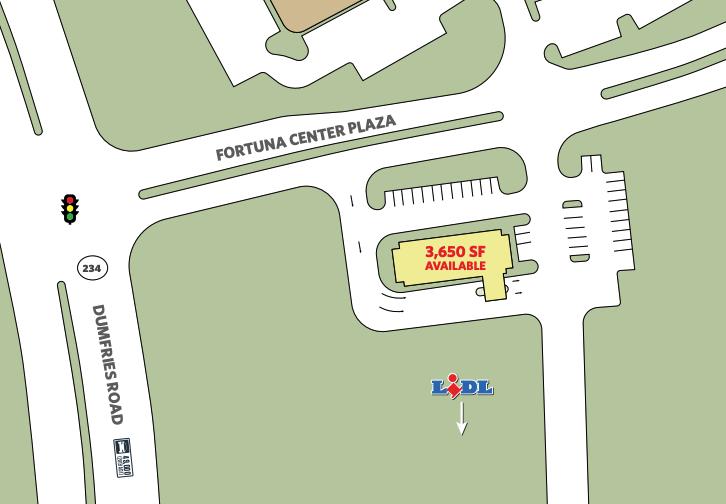
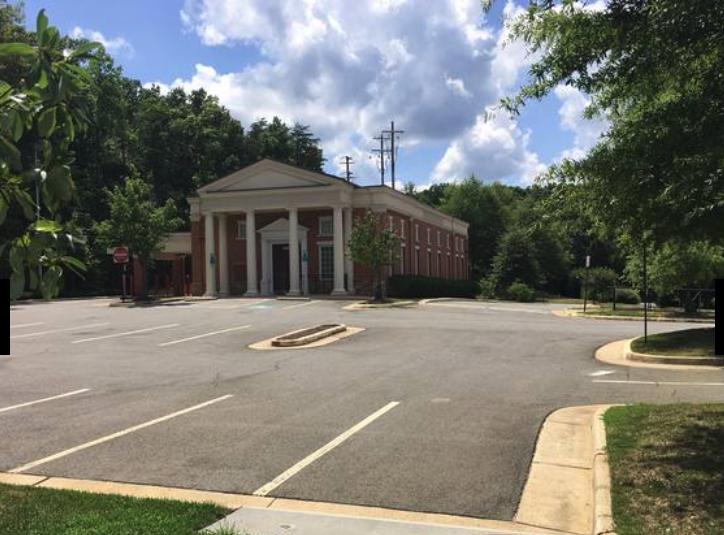
1-Mile | 3-Miles | 5-Miles | ||
---|---|---|---|---|
Total Population | 5,441 | 78,608 | 181,282 | |
Population Median Age | 44 | 35 | 35 | |
Population by Age | 0-9 Yrs | 697 (12%) | 12260 (15%) | 27578 (15%) |
10-19 Yrs | 485 (8%) | 11780 (14%) | 26435 (14%) | |
20-29 Yrs | 484 (8%) | 9996 (12%) | 24471 (13%) | |
30-39 Yrs | 675 (12%) | 11983 (15%) | 27885 (15%) | |
40-49 Yrs | 622 (11%) | 11552 (14%) | 26569 (14%) | |
50-59 Yrs | 753 (13%) | 10321 (13%) | 24146 (13%) | |
60-69 Yrs | 659 (12%) | 6345 (8%) | 14730 (8%) | |
70+ Yrs | 1067 (19%) | 4369 (5%) | 9470 (5%) | |
Median HH Income | $107,243 | $102,559 | $99,505 | |
Total Household Income | < 24K | 105 (4%) | 1860 (7%) | 4428 (7%) |
25-49K | 183 (8%) | 2985 (12%) | 7596 (13%) | |
50-74K | 353 (16%) | 3086 (12%) | 7842 (14%) | |
75-99K | 343 (15%) | 3847 (15%) | 8193 (14%) | |
100-199K | 870 (40%) | 8803 (36%) | 19866 (35%) | |
200K+ | 295 (13%) | 3629 (14%) | 7870 (14%) | |
Highest Education Level | No Diploma | 231 | 5736 | 15307 |
Diploma or GED | 589 | 9660 | 23626 | |
Some College | 778 | 10789 | 23752 | |
Assoc. Degree | 267 | 3654 | 8806 | |
Bachelors Degree | 1164 | 11015 | 25438 | |
Higher Degree | 942 | 8483 | 18069 | |
Total Housing Units | 2,236 | 25,680 | 58,931 | |
--Owner-Occupied | 1,823 | 17,217 | 39,714 | |
--Renter-Occupied | 325 | 6,993 | 16,080 | |
Owner-Occupied Values | < 100K | 21 | 426 | 1082 |
100-199K | 89 | 888 | 2175 | |
200-299K | 283 | 4946 | 11843 | |
300-399K | 486 | 4241 | 10838 | |
400-499K | 650 | 3976 | 7491 | |
500K+ | 295 | 2740 | 6285 | |
Total Working Age Population | 4,473 | 58,920 | 137,623 | |
In Work Force | 2,686 | 43,470 | 100,570 | |
Not In Work Force | 1,788 | 15,451 | 37,053 | |
Workforce Employed | 2,418 | 40,389 | 92,590 | |
Workforce Unemployed | 161 | 2,136 | 4,981 | |
Civlian Workforce | 2,579 | 42,525 | 97,572 | |
Military Workforce | 107 | 945 | 2,998 | |
Total Households | 2,148 | 24,210 | 55,794 | |
Family Households | 1,507 | 18,527 | 42,298 | |
Non-Family Households | 641 | 5,683 | 13,497 | |
Married Couple | 1,290 | 13,742 | 31,998 | |
Other Family | 216 | 4,785 | 10,299 | |
Married w/Child | 405 | 6,883 | 16,349 | |
Single Male w/Child | 31 | 684 | 1,516 | |
Single Female w/Child | 53 | 2,048 | 3,847 |
Population Change Last Two Decades - Plus Projection
2000 | % | 2010 | % | 2020 | % | 2030 | |
---|---|---|---|---|---|---|---|
Maryland | 5,296,486 | +9 | 5,773,552 | +6 | 6,141,900 | +6 | 6,518,750 |
Charles County | 120,546 | +22 | 146,551 | +14 | 167,050 | +17 | 194,650 |
Virginia | 7,078,515 | +13 | 8,001,024 | +8 | 8,655,021 | +8 | 9,331,666 |
Fairfax County | 969,749 | +12 | 1,081,726 | +7 | 1,162,504 | +7 | 1,244,025 |
Prince William County | 280,813 | +43 | 402,002 | +19 | 478,134 | +20 | 571,844 |
Stafford County | 92,446 | +39 | 128,961 | +19 | 154,093 | +19 | 183,161 |
Total Working Age Population:
Total Households:
Total Working Age Population:
Total Households:
Total Working Age Population:
Total Households: