Retail Space
1 North Indiana Street Greencastle, IN 46135
1 North Indiana Street Greencastle, IN 46135
Details & Description
Property Highlights
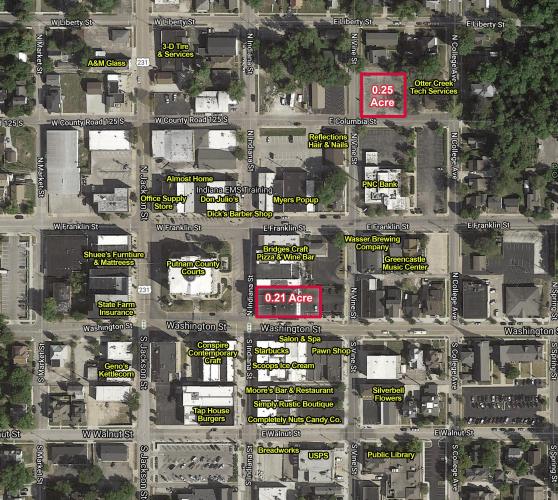
• Perfect for conversion to apartments and a vacant lot available for new retail or multi-family construction.
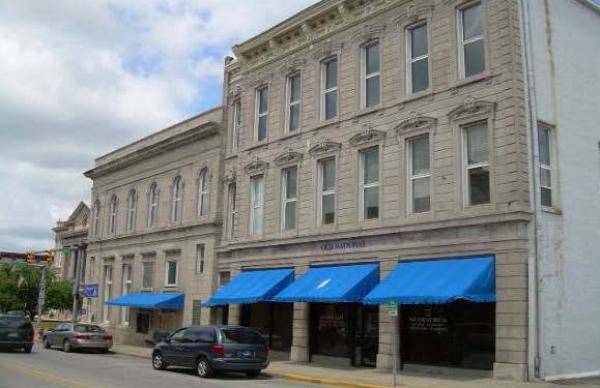
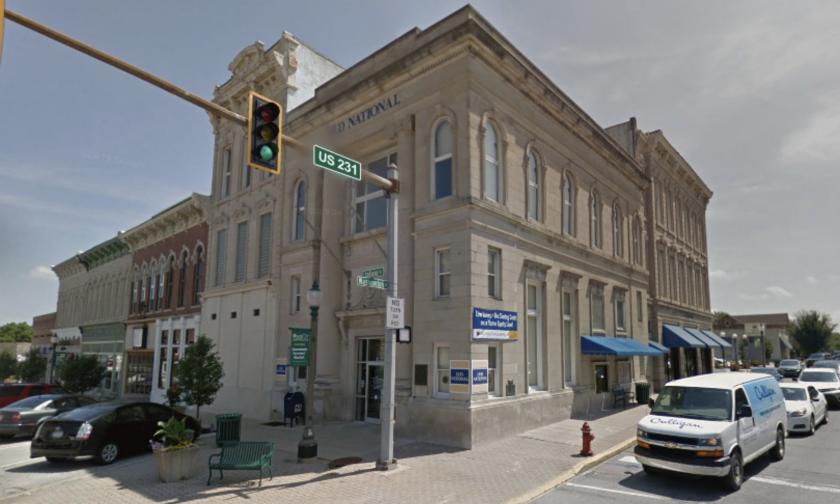
• Three-floor 27,300 SF former bank branch building and parking lot for sale on 0.21 acre lot.
Listing Agents

Jeffrey Harris
O: 317-566-5610
M: 317-331-8888
jharris@cressy.com
O: 317-566-5610
M: 317-331-8888
jharris@cressy.com

Joe Lonnemann
O: 317-566-5624
M: 317-752-3002
jlonnemann@cressy.com
O: 317-566-5624
M: 317-752-3002
jlonnemann@cressy.com
While we strive to provide the most accurate information, all listing information, and demographic data, is provided by third-parties. As such, MyEListing will not be responsible for the accuracy of the information. It is strongly recommended that you verify all information with the listing agent, and any relevant agencies, prior to making any decisions.