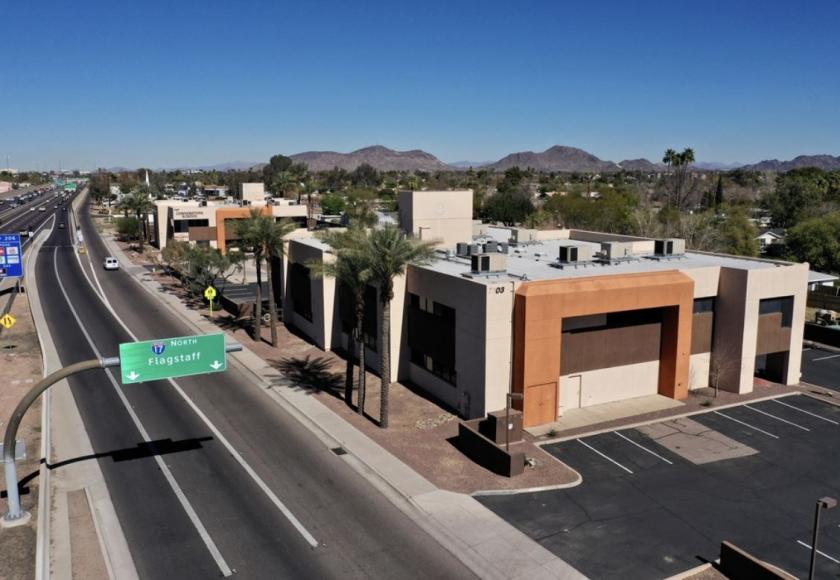
SVN is pleased to present for sale a portfolio of two 2-story office buildings totaling ±38,510 RSF situated on approximately 2.62 acres. An owner/user or investor has a unique opportunity to purchase both properties together or the single vacant building (7103 N Black Canyon Hwy) located on the south end of this complex. The north building is approximately 19,398 square feet and is currently 100% occupied by two tenants. Neutron Industries currently occupies the ground level of the 7107 building. Neutron manufactures and distributes commercial cleaning chemical products. Their other business center operation is located in Ohio. The second-floor space of the 7107 building is occupied by Cornerstone Charter School, which services students ages 13-21. There is additional rental income in the 7103 building as T-Mobile currently has a rooftop cell tower lease in place until 2036. They are currently paying $13,996.80 annually and have a 7% rental increase in October of 2021. The 7103 building is approximately 19,112 square feet and is currently vacant. This building can be purchased on its own and presents a great opportunity for an owner/occupant or investor looking to capitalize on a ±20,000 SF second generation buildout with great freeway exposure. Both buildings are concrete masonry construction. Between 2016-2018, Ownership added nearly $740,000 worth of capital expenditures. These items consisted of security fob updates, parking lot paving, roof replacement, exterior paint, HVAC replacement, and irrigation improvements. The capital expenditures for the vacant 7103 building alone were upwards of $380,000.