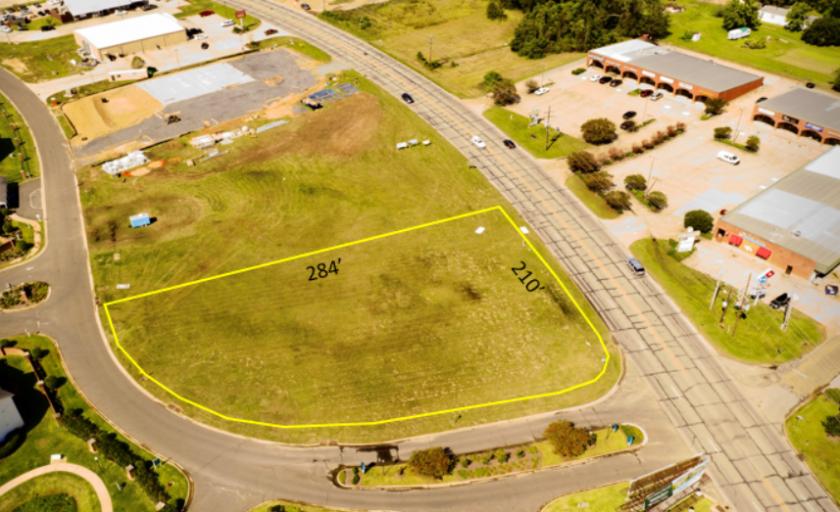
±.93 Acres of Commercial Vacant Land Available in West Monroe
Parcel sits at the Corner of Cypress St and Ashford Drive
One of the last remaining vacant lots along Ashford Dr.
Subject Property is adjacent to thriving Ashford Place Apartments
Centrally located between Downing Pines and Well Road Exit
Neighboring businesses include O Reilly Auto Parts, Family Dollar,
Slim Chickens Restaurant, and Guaranty Bank
High Visibility & Traffic Count
Less than 1 Mile from Interstate 20
No part of this information may be copied, reproduced, repurposed, or screen-captured for any commercial purpose without prior written authorization from MyEListing.
While we strive to provide the most accurate information, all listing information, and demographic data, is provided by third-parties. As such, MyEListing will not be responsible for the accuracy of the information. It is strongly recommended that you verify all information with the listing agent, and any relevant agencies, prior to making any decisions.
What is the asking price for 5075 Cypress St in West Monroe?
The asking price for 5075 Cypress St is $475,000
How much land does the West Monroe, LA property at 5075 Cypress St include?
5075 Cypress St in West Monroe includes 0.930 acres of land
What kind of Land is the propery at 5075 Cypress St?
The property at 5075 Cypress St West Monroe, LA 71291 is listed as a Mixed Use Land Land property
What is the population within 1 mile of 5075 Cypress St in West Monroe?
The population within 1 mile of 5075 Cypress St West Monroe, LA 71291 is 3,680 people.
Who do I contact for questions about 5075 Cypress St?
You should contact the listing agent,
Will Watson, for any details regarding this commercial listing.