Industrial Properties
8620 Louisiana 67 Clinton, LA 70722
8620 Louisiana 67 Clinton, LA 70722

Details & Description
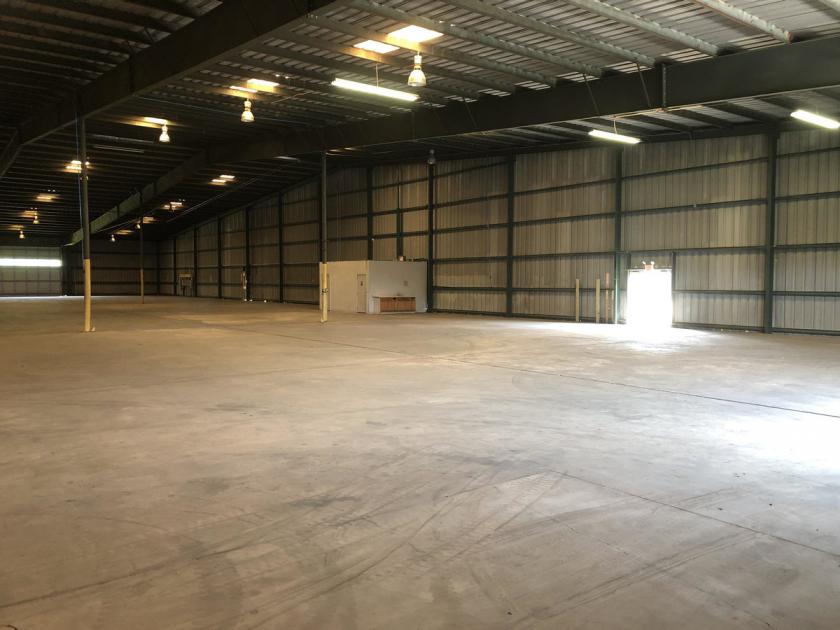
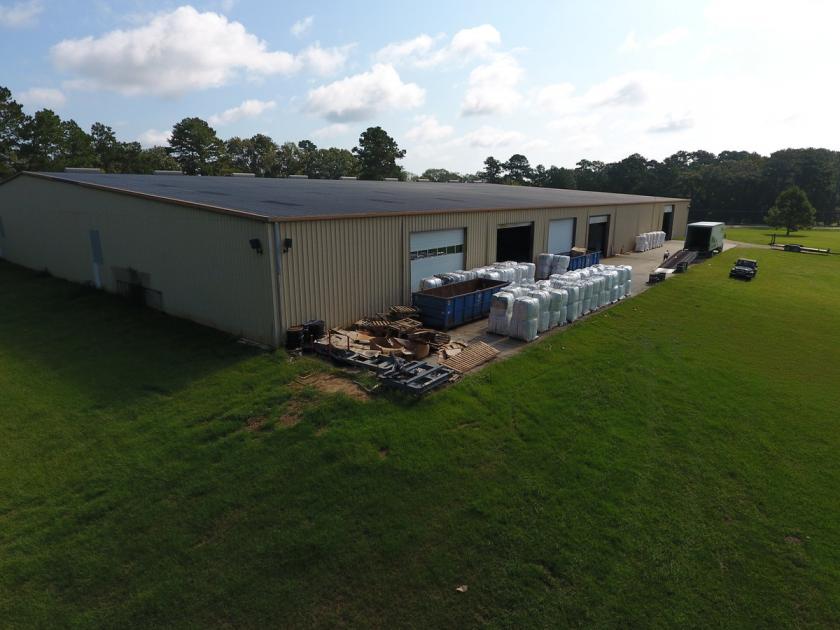
Additional Photos


Listing Agents

Walt Ketchings
O: 225-295-0800
M: 225-241-3110
wketchings@latterblum.com
O: 225-295-0800
M: 225-241-3110
wketchings@latterblum.com

Brennan Hammett
NAI Latter & Blum
O: 225-295-0800
M: 225-620-5690
brennanh@latterblum.com
NAI Latter & Blum
O: 225-295-0800
M: 225-620-5690
brennanh@latterblum.com
While we strive to provide the most accurate information, all listing information, and demographic data, is provided by third-parties. As such, MyEListing will not be responsible for the accuracy of the information. It is strongly recommended that you verify all information with the listing agent, and any relevant agencies, prior to making any decisions.


