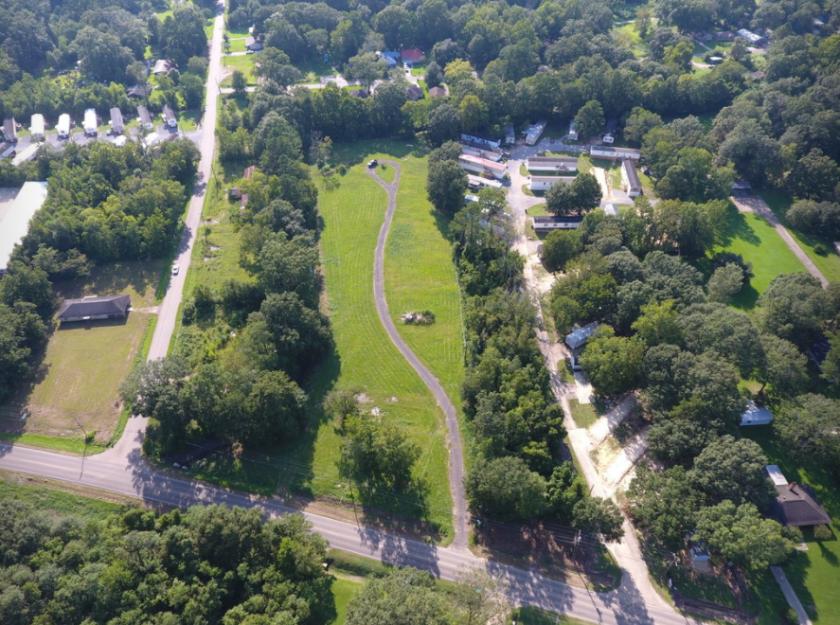
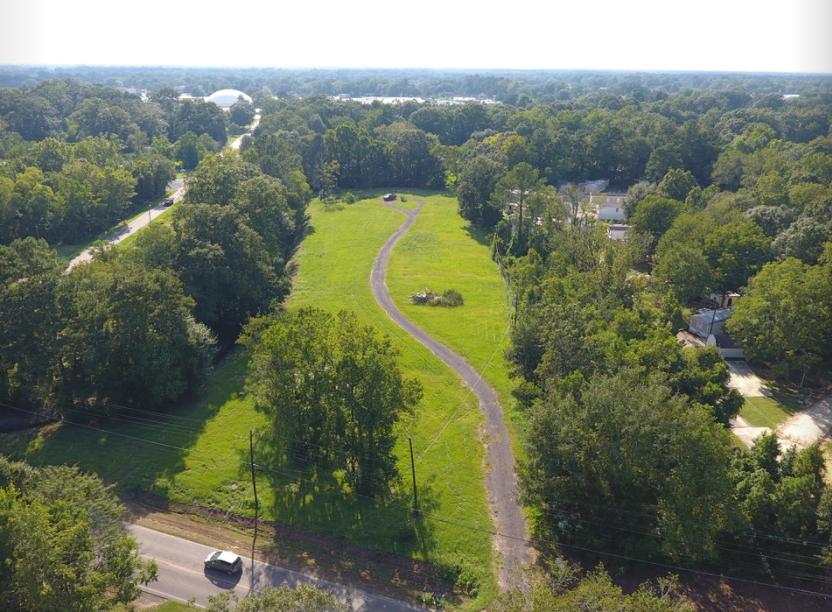
1-Mile | 3-Miles | 5-Miles | ||
---|---|---|---|---|
Total Population | 3,106 | 28,125 | 74,973 | |
Population Median Age | 37 | 37 | 36 | |
Population by Age | 0-9 Yrs | 550 (17%) | 4164 (14%) | 11279 (15%) |
10-19 Yrs | 363 (11%) | 3955 (14%) | 11271 (15%) | |
20-29 Yrs | 470 (15%) | 3729 (13%) | 9716 (12%) | |
30-39 Yrs | 338 (10%) | 3742 (13%) | 11732 (15%) | |
40-49 Yrs | 286 (9%) | 3241 (11%) | 8867 (11%) | |
50-59 Yrs | 390 (12%) | 3340 (11%) | 8721 (11%) | |
60-69 Yrs | 356 (11%) | 3257 (11%) | 7407 (9%) | |
70+ Yrs | 354 (11%) | 2696 (9%) | 5979 (7%) | |
Median HH Income | $40,645 | $62,003 | $68,469 | |
Total Household Income | < 24K | 322 (26%) | 1715 (17%) | 3998 (15%) |
25-49K | 384 (31%) | 2382 (24%) | 5487 (21%) | |
50-74K | 230 (18%) | 1766 (18%) | 4575 (17%) | |
75-99K | 80 (6%) | 1022 (10%) | 3459 (13%) | |
100-199K | 195 (15%) | 2430 (24%) | 6938 (26%) | |
200K+ | 22 (1%) | 478 (4%) | 1248 (4%) | |
Highest Education Level | No Diploma | 363 | 2179 | 4871 |
Diploma or GED | 733 | 6144 | 15866 | |
Some College | 419 | 4275 | 11294 | |
Assoc. Degree | 116 | 1064 | 3370 | |
Bachelors Degree | 167 | 2767 | 8407 | |
Higher Degree | 188 | 1524 | 3936 | |
Total Housing Units | 1,436 | 11,925 | 30,551 | |
--Owner-Occupied | 608 | 7,247 | 19,913 | |
--Renter-Occupied | 624 | 2,548 | 5,792 | |
Owner-Occupied Values | < 100K | 243 | 1455 | 3066 |
100-199K | 238 | 3403 | 9343 | |
200-299K | 84 | 1617 | 4625 | |
300-399K | 8 | 459 | 1765 | |
400-499K | 20 | 196 | 513 | |
500K+ | 16 | 116 | 600 | |
Total Working Age Population | 2,352 | 21,421 | 56,627 | |
In Work Force | 1,486 | 13,442 | 37,245 | |
Not In Work Force | 866 | 7,978 | 19,382 | |
Workforce Employed | 1,368 | 12,805 | 35,567 | |
Workforce Unemployed | 118 | 589 | 1,551 | |
Civlian Workforce | 1,486 | 13,394 | 37,118 | |
Military Workforce | 0 | 49 | 127 | |
Total Households | 1,232 | 9,795 | 25,705 | |
Family Households | 701 | 6,620 | 18,017 | |
Non-Family Households | 531 | 3,175 | 7,688 | |
Married Couple | 330 | 4,388 | 12,495 | |
Other Family | 371 | 2,231 | 5,521 | |
Married w/Child | 119 | 1,928 | 5,744 | |
Single Male w/Child | 139 | 573 | 970 | |
Single Female w/Child | 102 | 758 | 2,036 |
Population Change Last Two Decades - Plus Projection
2000 | % | 2010 | % | 2020 | % | 2030 | |
---|---|---|---|---|---|---|---|
Louisiana | 4,468,976 | +1 | 4,533,372 | +1 | 4,588,310 | +5 | 4,813,420 |
East Baton Rouge Parish | 412,852 | +7 | 440,171 | -3 | 426,380 | -1 | 421,500 |
Iberville Parish | 33,320 | 0 | 33,387 | -17 | 27,830 | -11 | 24,640 |
Livingston Parish | 91,814 | +39 | 128,026 | +40 | 179,820 | +35 | 242,780 |
Total Working Age Population:
Total Households:
Total Working Age Population:
Total Households:
Total Working Age Population:
Total Households: