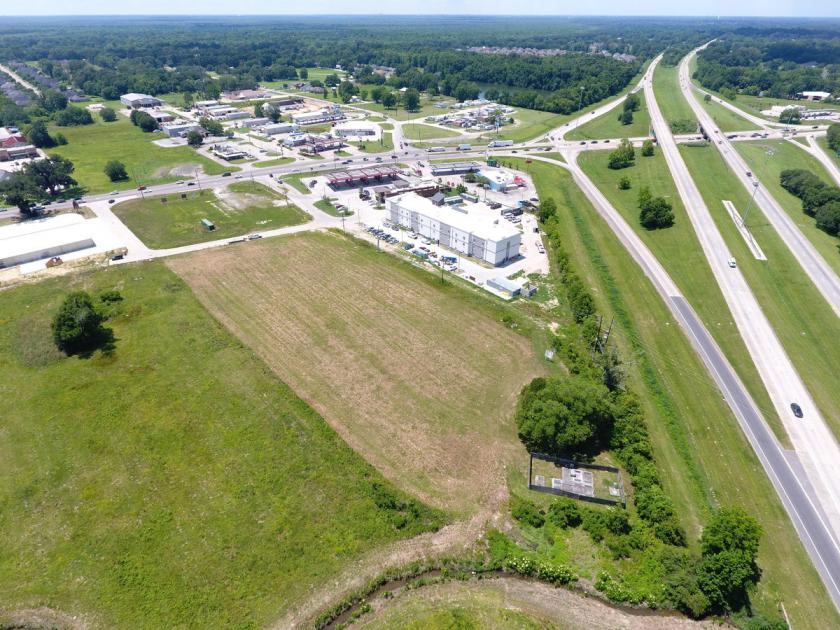
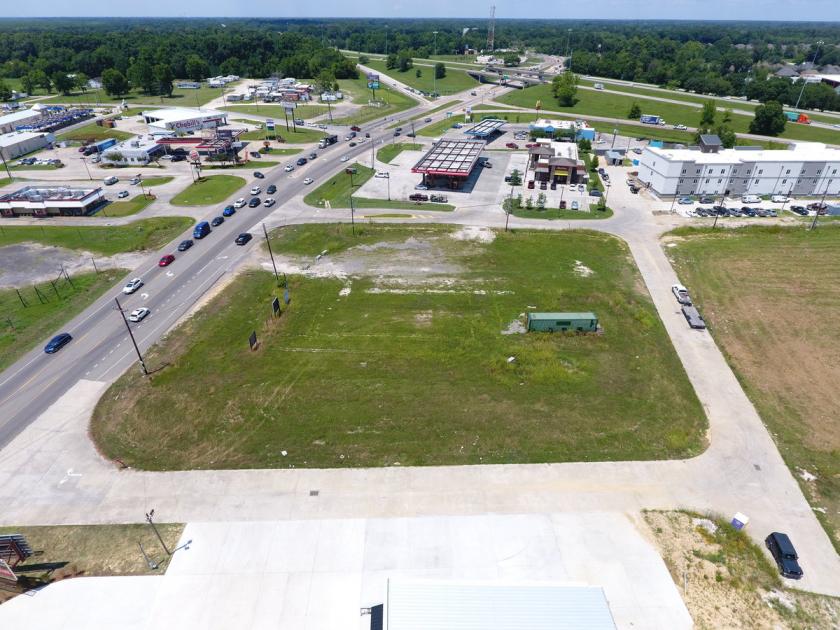
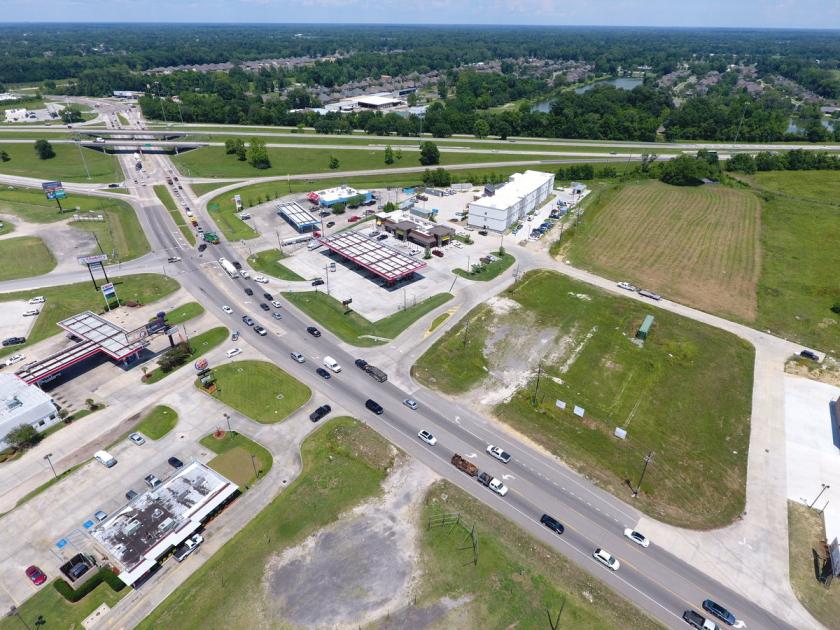
1-Mile | 3-Miles | 5-Miles | ||
---|---|---|---|---|
Total Population | 2,919 | 25,398 | 63,655 | |
Population Median Age | 36 | 35 | 35 | |
Population by Age | 0-9 Yrs | 359 (12%) | 3454 (13%) | 9849 (15%) |
10-19 Yrs | 492 (16%) | 4287 (16%) | 9718 (15%) | |
20-29 Yrs | 378 (12%) | 3204 (12%) | 7818 (12%) | |
30-39 Yrs | 422 (14%) | 3600 (14%) | 9823 (15%) | |
40-49 Yrs | 471 (16%) | 4253 (16%) | 9475 (14%) | |
50-59 Yrs | 372 (12%) | 3109 (12%) | 7498 (11%) | |
60-69 Yrs | 236 (8%) | 2023 (7%) | 5709 (8%) | |
70+ Yrs | 189 (6%) | 1466 (5%) | 3765 (5%) | |
Median HH Income | $117,563 | $101,232 | $91,200 | |
Total Household Income | < 24K | 47 (5%) | 730 (8%) | 2484 (11%) |
25-49K | 118 (12%) | 1044 (12%) | 3149 (14%) | |
50-74K | 134 (14%) | 1087 (13%) | 2914 (13%) | |
75-99K | 117 (12%) | 1232 (14%) | 3435 (15%) | |
100-199K | 374 (39%) | 3136 (37%) | 7349 (34%) | |
200K+ | 148 (15%) | 1050 (12%) | 2216 (10%) | |
Highest Education Level | No Diploma | 93 | 1025 | 3381 |
Diploma or GED | 453 | 4359 | 11230 | |
Some College | 443 | 3900 | 9313 | |
Assoc. Degree | 143 | 1262 | 3286 | |
Bachelors Degree | 484 | 3686 | 8836 | |
Higher Degree | 179 | 1522 | 4157 | |
Total Housing Units | 1,021 | 8,980 | 23,563 | |
--Owner-Occupied | 789 | 6,934 | 17,965 | |
--Renter-Occupied | 150 | 1,345 | 3,583 | |
Owner-Occupied Values | < 100K | 52 | 641 | 1967 |
100-199K | 192 | 1603 | 4876 | |
200-299K | 235 | 2391 | 6062 | |
300-399K | 181 | 1449 | 3074 | |
400-499K | 70 | 511 | 1128 | |
500K+ | 58 | 338 | 858 | |
Total Working Age Population | 2,209 | 19,072 | 47,787 | |
In Work Force | 1,612 | 13,661 | 34,048 | |
Not In Work Force | 597 | 5,411 | 13,739 | |
Workforce Employed | 1,535 | 12,966 | 32,199 | |
Workforce Unemployed | 72 | 661 | 1,798 | |
Civlian Workforce | 1,608 | 13,627 | 33,998 | |
Military Workforce | 4 | 34 | 50 | |
Total Households | 938 | 8,279 | 21,548 | |
Family Households | 748 | 6,380 | 16,135 | |
Non-Family Households | 190 | 1,899 | 5,413 | |
Married Couple | 591 | 5,054 | 12,740 | |
Other Family | 156 | 1,326 | 3,395 | |
Married w/Child | 285 | 2,503 | 6,282 | |
Single Male w/Child | 22 | 187 | 406 | |
Single Female w/Child | 59 | 560 | 1,621 |
Population Change Last Two Decades - Plus Projection
2000 | % | 2010 | % | 2020 | % | 2030 | |
---|---|---|---|---|---|---|---|
Louisiana | 4,468,976 | +1 | 4,533,372 | +1 | 4,588,310 | +5 | 4,813,420 |
Ascension Parish | 76,627 | +40 | 107,215 | +38 | 147,740 | +33 | 196,140 |
East Baton Rouge Parish | 412,852 | +7 | 440,171 | -3 | 426,380 | -1 | 421,500 |
Iberville Parish | 33,320 | 0 | 33,387 | -17 | 27,830 | -11 | 24,640 |
Livingston Parish | 91,814 | +39 | 128,026 | +40 | 179,820 | +35 | 242,780 |
Total Working Age Population:
Total Households:
Total Working Age Population:
Total Households:
Total Working Age Population:
Total Households: