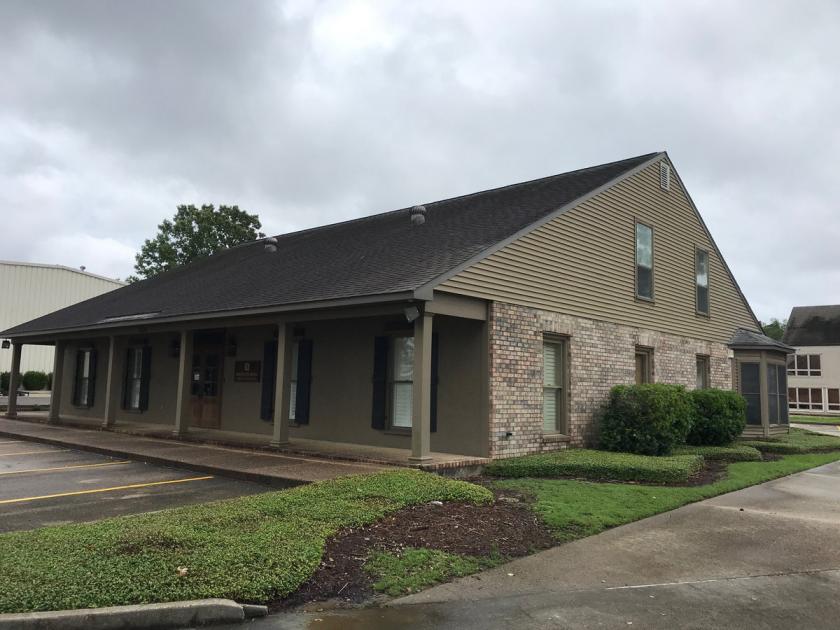
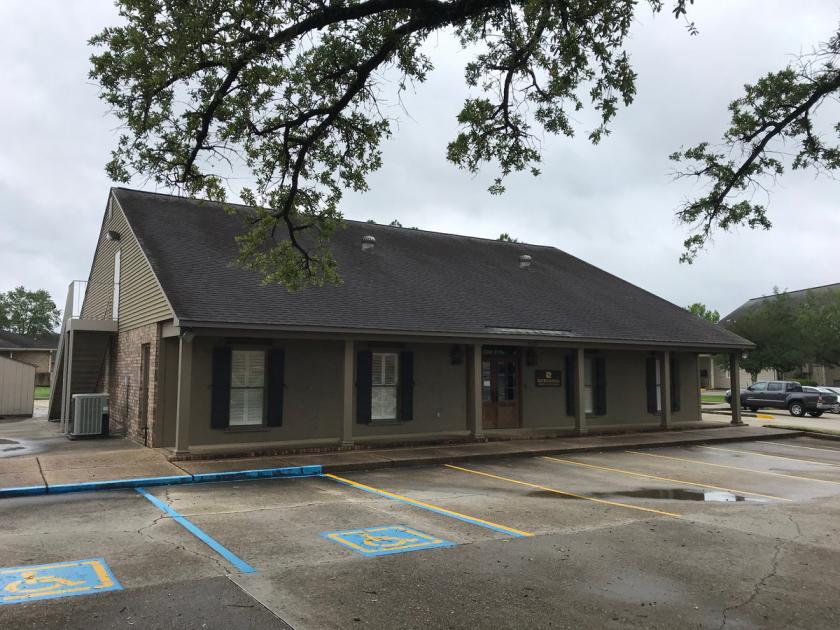
1-Mile | 3-Miles | 5-Miles | ||
---|---|---|---|---|
Total Population | 7,789 | 78,021 | 200,997 | |
Population Median Age | 40 | 38 | 38 | |
Population by Age | 0-9 Yrs | 1023 (13%) | 10260 (13%) | 25170 (12%) |
10-19 Yrs | 816 (10%) | 7489 (9%) | 23398 (11%) | |
20-29 Yrs | 1173 (15%) | 14372 (18%) | 33835 (16%) | |
30-39 Yrs | 1057 (13%) | 11396 (14%) | 29108 (14%) | |
40-49 Yrs | 812 (10%) | 8465 (10%) | 22645 (11%) | |
50-59 Yrs | 875 (11%) | 8580 (10%) | 23450 (11%) | |
60-69 Yrs | 1055 (13%) | 8456 (10%) | 22288 (11%) | |
70+ Yrs | 977 (12%) | 9003 (11%) | 21104 (10%) | |
Median HH Income | $72,793 | $57,012 | $58,484 | |
Total Household Income | < 24K | 438 (14%) | 6484 (20%) | 16776 (20%) |
25-49K | 578 (18%) | 7783 (24%) | 17914 (22%) | |
50-74K | 572 (18%) | 6097 (18%) | 13688 (17%) | |
75-99K | 550 (18%) | 3980 (12%) | 9360 (11%) | |
100-199K | 754 (24%) | 6119 (18%) | 16919 (21%) | |
200K+ | 153 (5%) | 1856 (5%) | 5410 (6%) | |
Highest Education Level | No Diploma | 101 | 3561 | 10777 |
Diploma or GED | 1251 | 13639 | 33030 | |
Some College | 1506 | 12983 | 31381 | |
Assoc. Degree | 289 | 2927 | 7036 | |
Bachelors Degree | 1592 | 12773 | 32528 | |
Higher Degree | 571 | 7332 | 20133 | |
Total Housing Units | 3,203 | 37,214 | 93,140 | |
--Owner-Occupied | 2,308 | 16,906 | 46,916 | |
--Renter-Occupied | 736 | 15,412 | 33,151 | |
Owner-Occupied Values | < 100K | 84 | 1455 | 5559 |
100-199K | 1058 | 7219 | 18382 | |
200-299K | 846 | 4902 | 12011 | |
300-399K | 157 | 1571 | 5452 | |
400-499K | 66 | 572 | 1922 | |
500K+ | 97 | 1186 | 3591 | |
Total Working Age Population | 6,262 | 63,298 | 162,359 | |
In Work Force | 4,065 | 43,157 | 109,026 | |
Not In Work Force | 2,197 | 20,141 | 53,334 | |
Workforce Employed | 4,019 | 41,164 | 103,298 | |
Workforce Unemployed | 46 | 1,967 | 5,616 | |
Civlian Workforce | 4,065 | 43,131 | 108,914 | |
Military Workforce | 0 | 26 | 112 | |
Total Households | 3,045 | 32,318 | 80,067 | |
Family Households | 1,868 | 16,779 | 45,289 | |
Non-Family Households | 1,177 | 15,539 | 34,778 | |
Married Couple | 1,320 | 10,916 | 29,594 | |
Other Family | 548 | 5,863 | 15,694 | |
Married w/Child | 316 | 3,947 | 10,586 | |
Single Male w/Child | 49 | 699 | 1,456 | |
Single Female w/Child | 350 | 2,267 | 6,040 |
Population Change Last Two Decades - Plus Projection
2000 | % | 2010 | % | 2020 | % | 2030 | |
---|---|---|---|---|---|---|---|
Louisiana | 4,468,976 | +1 | 4,533,372 | +1 | 4,588,310 | +5 | 4,813,420 |
East Baton Rouge Parish | 412,852 | +7 | 440,171 | -3 | 426,380 | -1 | 421,500 |
Iberville Parish | 33,320 | 0 | 33,387 | -17 | 27,830 | -11 | 24,640 |
St. Martin Parish | 48,583 | +7 | 52,160 | +6 | 55,520 | +3 | 57,000 |
West Baton Rouge Parish | 21,601 | +10 | 23,788 | -7 | 22,220 | -5 | 21,070 |
Total Working Age Population:
Total Households:
Total Working Age Population:
Total Households:
Total Working Age Population:
Total Households: