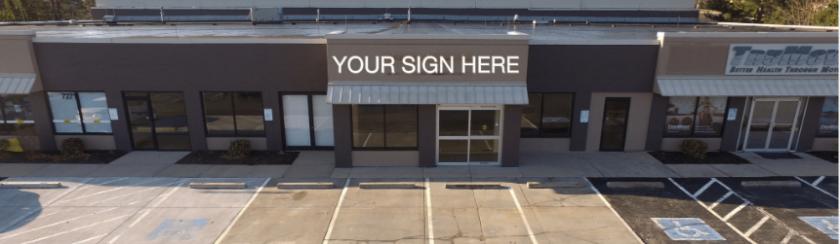
1-Mile | 3-Miles | 5-Miles | ||
---|---|---|---|---|
Total Population | 7,768 | 89,067 | 253,085 | |
Population Median Age | 45 | 42 | 40 | |
Population by Age | 0-9 Yrs | 748 (9%) | 9750 (10%) | 28561 (11%) |
10-19 Yrs | 579 (7%) | 9095 (10%) | 27347 (10%) | |
20-29 Yrs | 1088 (14%) | 11989 (13%) | 36738 (14%) | |
30-39 Yrs | 1025 (13%) | 12755 (14%) | 37189 (14%) | |
40-49 Yrs | 716 (9%) | 9458 (10%) | 28412 (11%) | |
50-59 Yrs | 906 (11%) | 11234 (12%) | 32967 (13%) | |
60-69 Yrs | 1199 (15%) | 12247 (13%) | 30938 (12%) | |
70+ Yrs | 1506 (19%) | 12538 (14%) | 30931 (12%) | |
Median HH Income | $70,562 | $78,909 | $79,293 | |
Total Household Income | < 24K | 440 (11%) | 3812 (9%) | 11053 (10%) |
25-49K | 954 (24%) | 7518 (19%) | 21698 (19%) | |
50-74K | 729 (18%) | 7540 (19%) | 19468 (17%) | |
75-99K | 664 (16%) | 5495 (13%) | 15200 (13%) | |
100-199K | 884 (22%) | 10960 (27%) | 29602 (26%) | |
200K+ | 285 (7%) | 4134 (10%) | 12638 (11%) | |
Highest Education Level | No Diploma | 151 | 1784 | 6186 |
Diploma or GED | 876 | 8325 | 24103 | |
Some College | 1348 | 11930 | 32746 | |
Assoc. Degree | 398 | 4211 | 11923 | |
Bachelors Degree | 2133 | 23738 | 65044 | |
Higher Degree | 1156 | 14924 | 41582 | |
Total Housing Units | 4,415 | 41,984 | 117,079 | |
--Owner-Occupied | 2,395 | 25,108 | 66,829 | |
--Renter-Occupied | 1,562 | 14,351 | 42,831 | |
Owner-Occupied Values | < 100K | 80 | 991 | 2796 |
100-199K | 708 | 7015 | 19365 | |
200-299K | 975 | 9075 | 19929 | |
300-399K | 425 | 4562 | 12253 | |
400-499K | 153 | 1435 | 5697 | |
500K+ | 55 | 2029 | 6790 | |
Total Working Age Population | 6,681 | 73,773 | 207,531 | |
In Work Force | 4,307 | 50,957 | 145,616 | |
Not In Work Force | 2,374 | 22,815 | 61,915 | |
Workforce Employed | 4,218 | 49,567 | 141,172 | |
Workforce Unemployed | 89 | 1,328 | 4,337 | |
Civlian Workforce | 4,307 | 50,895 | 145,509 | |
Military Workforce | 0 | 63 | 107 | |
Total Households | 3,957 | 39,458 | 109,660 | |
Family Households | 1,950 | 23,406 | 64,809 | |
Non-Family Households | 2,007 | 16,053 | 44,851 | |
Married Couple | 1,549 | 19,057 | 51,973 | |
Other Family | 401 | 4,349 | 12,836 | |
Married w/Child | 479 | 6,878 | 19,920 | |
Single Male w/Child | 70 | 551 | 1,801 | |
Single Female w/Child | 62 | 1,517 | 5,133 |
Population Change Last Two Decades - Plus Projection
2000 | % | 2010 | % | 2020 | % | 2030 | |
---|---|---|---|---|---|---|---|
Kansas | 2,688,418 | +6 | 2,853,118 | +5 | 2,988,194 | +5 | 3,140,008 |
Johnson County | 451,086 | +21 | 544,179 | +15 | 625,524 | +17 | 734,065 |
Wyandotte County | 157,882 | 0 | 157,505 | +5 | 165,672 | +2 | 169,789 |
Missouri | 5,595,211 | +7 | 5,988,927 | +7 | 6,389,850 | +6 | 6,746,762 |
Jackson County | 654,880 | +3 | 674,158 | +2 | 689,226 | +4 | 714,467 |
Total Working Age Population:
Total Households:
Total Working Age Population:
Total Households:
Total Working Age Population:
Total Households: