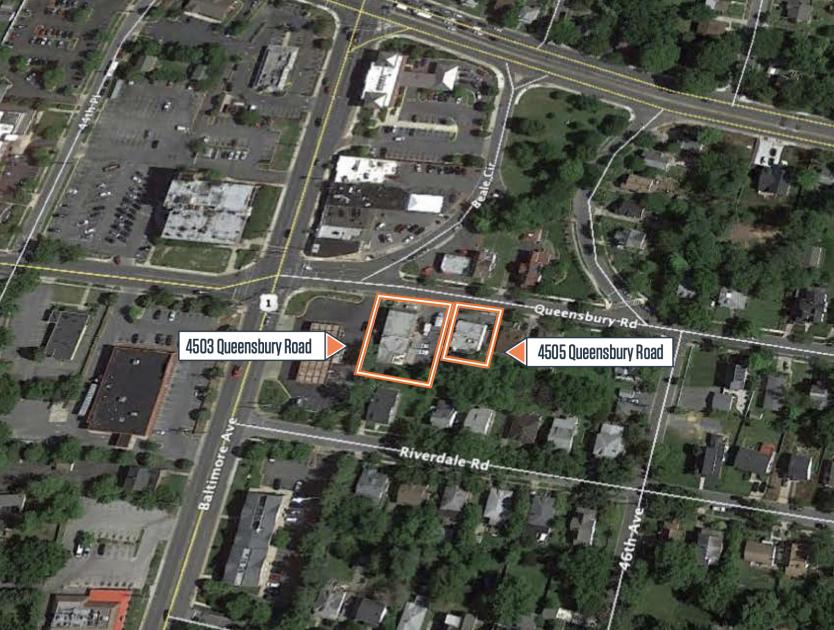
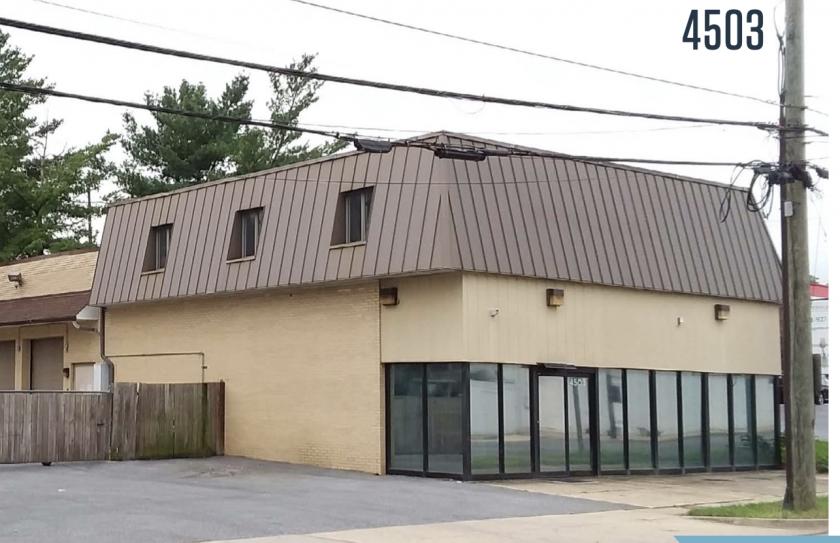
1-Mile | 3-Miles | 5-Miles | ||
---|---|---|---|---|
Total Population | 17,127 | 181,879 | 534,374 | |
Population Median Age | 37 | 35 | 36 | |
Population by Age | 0-9 Yrs | 2213 (12%) | 25111 (13%) | 74625 (13%) |
10-19 Yrs | 2153 (12%) | 27067 (14%) | 66893 (12%) | |
20-29 Yrs | 2273 (13%) | 32029 (17%) | 86822 (16%) | |
30-39 Yrs | 3095 (18%) | 28321 (15%) | 89204 (16%) | |
40-49 Yrs | 2371 (13%) | 21326 (11%) | 66318 (12%) | |
50-59 Yrs | 2318 (13%) | 19518 (10%) | 62506 (11%) | |
60-69 Yrs | 1561 (9%) | 16094 (8%) | 49091 (9%) | |
70+ Yrs | 1143 (6%) | 12412 (6%) | 38914 (7%) | |
Median HH Income | $90,883 | $69,708 | $68,793 | |
Total Household Income | < 24K | 565 (9%) | 8450 (15%) | 30010 (16%) |
25-49K | 914 (16%) | 10783 (19%) | 34333 (19%) | |
50-74K | 804 (14%) | 10407 (18%) | 32012 (18%) | |
75-99K | 898 (15%) | 7857 (14%) | 22888 (12%) | |
100-199K | 1725 (30%) | 13935 (25%) | 43374 (24%) | |
200K+ | 801 (14%) | 3844 (6%) | 15142 (8%) | |
Highest Education Level | No Diploma | 2602 | 28690 | 69067 |
Diploma or GED | 1858 | 26765 | 83737 | |
Some College | 1806 | 18415 | 60050 | |
Assoc. Degree | 394 | 5823 | 17623 | |
Bachelors Degree | 2133 | 17776 | 63955 | |
Higher Degree | 2873 | 15008 | 57718 | |
Total Housing Units | 6,094 | 58,861 | 192,053 | |
--Owner-Occupied | 3,340 | 26,893 | 85,846 | |
--Renter-Occupied | 2,366 | 28,383 | 91,912 | |
Owner-Occupied Values | < 100K | 32 | 833 | 3545 |
100-199K | 214 | 2959 | 9405 | |
200-299K | 705 | 8280 | 19752 | |
300-399K | 971 | 7748 | 19261 | |
400-499K | 806 | 3581 | 12320 | |
500K+ | 612 | 3491 | 21563 | |
Total Working Age Population | 13,460 | 144,804 | 424,810 | |
In Work Force | 10,027 | 99,382 | 298,133 | |
Not In Work Force | 3,433 | 45,422 | 126,677 | |
Workforce Employed | 9,589 | 94,204 | 277,295 | |
Workforce Unemployed | 431 | 5,059 | 20,436 | |
Civlian Workforce | 10,019 | 99,264 | 297,731 | |
Military Workforce | 8 | 119 | 403 | |
Total Households | 5,707 | 55,276 | 177,758 | |
Family Households | 3,684 | 33,967 | 106,007 | |
Non-Family Households | 2,023 | 21,308 | 71,751 | |
Married Couple | 2,699 | 20,900 | 59,704 | |
Other Family | 984 | 13,068 | 46,302 | |
Married w/Child | 1,330 | 9,560 | 27,440 | |
Single Male w/Child | 151 | 2,289 | 5,935 | |
Single Female w/Child | 183 | 3,561 | 14,307 |
Population Change Last Two Decades - Plus Projection
2000 | % | 2010 | % | 2020 | % | 2030 | |
---|---|---|---|---|---|---|---|
District of Columbia | 572,059 | +5 | 601,723 | +21 | 729,501 | +15 | 842,154 |
Maryland | 5,296,486 | +9 | 5,773,552 | +6 | 6,141,900 | +6 | 6,518,750 |
Montgomery County | 873,341 | +11 | 971,777 | +8 | 1,052,050 | +7 | 1,128,800 |
Prince Georges County | 801,515 | +8 | 863,420 | +6 | 916,150 | +4 | 952,950 |
Total Working Age Population:
Total Households:
Total Working Age Population:
Total Households:
Total Working Age Population:
Total Households: