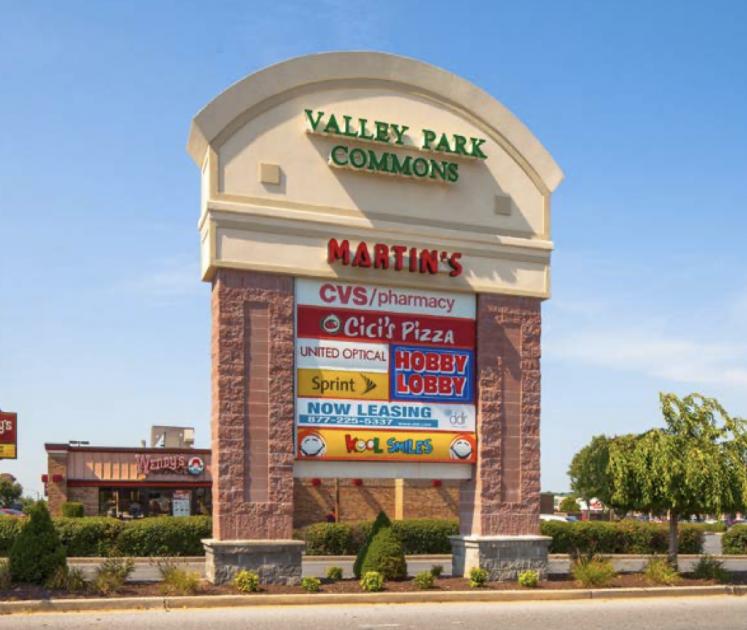
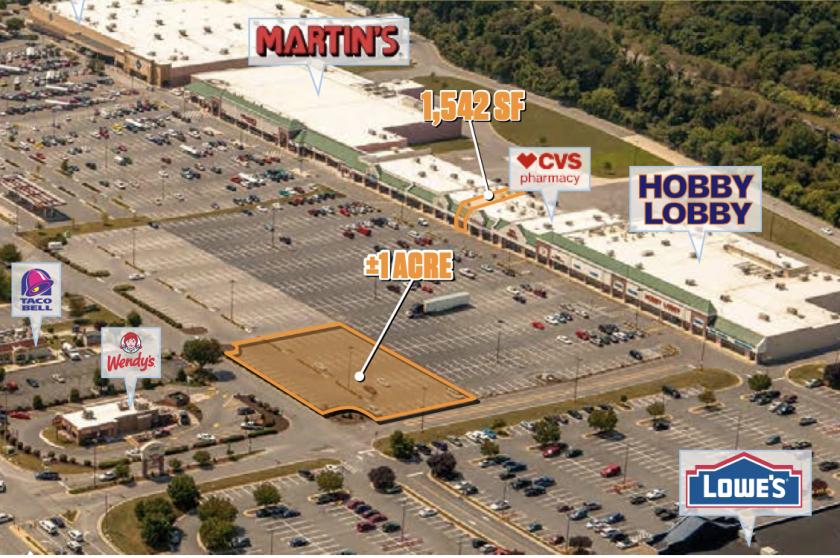
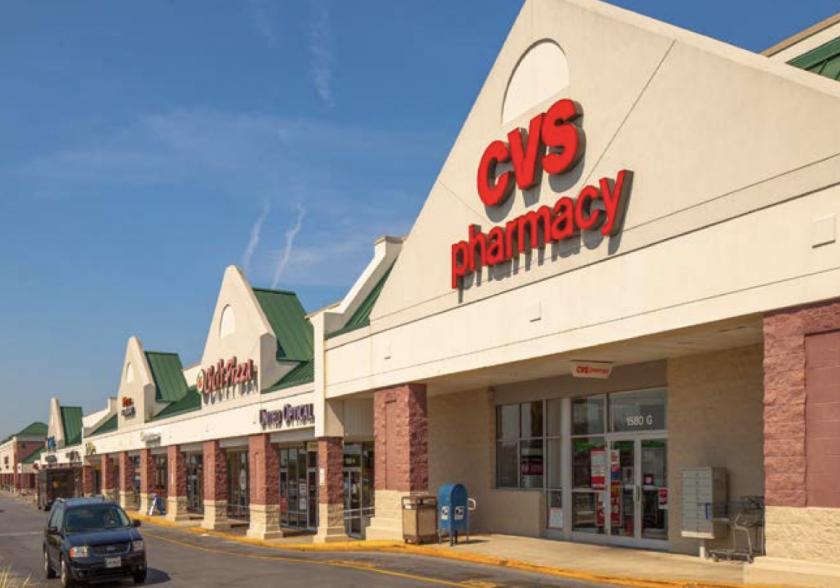
1-Mile | 3-Miles | 5-Miles | ||
---|---|---|---|---|
Total Population | 4,776 | 45,137 | 83,673 | |
Population Median Age | 35 | 39 | 39 | |
Population by Age | 0-9 Yrs | 916 (19%) | 6134 (13%) | 11064 (13%) |
10-19 Yrs | 436 (9%) | 5574 (12%) | 10178 (12%) | |
20-29 Yrs | 826 (17%) | 6004 (13%) | 10719 (12%) | |
30-39 Yrs | 670 (14%) | 5812 (12%) | 10905 (13%) | |
40-49 Yrs | 487 (10%) | 5359 (11%) | 10537 (12%) | |
50-59 Yrs | 580 (12%) | 6358 (14%) | 11178 (13%) | |
60-69 Yrs | 538 (11%) | 4983 (11%) | 9276 (11%) | |
70+ Yrs | 322 (6%) | 4914 (10%) | 9817 (11%) | |
Median HH Income | $46,615 | $45,066 | $52,889 | |
Total Household Income | < 24K | 533 (31%) | 5195 (28%) | 7797 (23%) |
25-49K | 382 (22%) | 4818 (26%) | 8168 (24%) | |
50-74K | 272 (16%) | 3047 (16%) | 5732 (17%) | |
75-99K | 215 (12%) | 2243 (12%) | 4455 (13%) | |
100-199K | 295 (17%) | 2799 (15%) | 6322 (18%) | |
200K+ | 2 (0%) | 276 (1%) | 868 (2%) | |
Highest Education Level | No Diploma | 630 | 4866 | 7711 |
Diploma or GED | 1072 | 12041 | 20943 | |
Some College | 663 | 6414 | 12008 | |
Assoc. Degree | 250 | 2352 | 4552 | |
Bachelors Degree | 365 | 3084 | 7384 | |
Higher Degree | 89 | 2008 | 4822 | |
Total Housing Units | 1,839 | 20,594 | 36,794 | |
--Owner-Occupied | 862 | 9,317 | 18,961 | |
--Renter-Occupied | 837 | 9,061 | 14,382 | |
Owner-Occupied Values | < 100K | 115 | 1590 | 2439 |
100-199K | 572 | 5067 | 8946 | |
200-299K | 150 | 1945 | 5088 | |
300-399K | 14 | 401 | 1534 | |
400-499K | 0 | 107 | 463 | |
500K+ | 11 | 207 | 490 | |
Total Working Age Population | 3,544 | 35,635 | 66,588 | |
In Work Force | 2,237 | 22,123 | 41,072 | |
Not In Work Force | 1,307 | 13,511 | 25,516 | |
Workforce Employed | 2,129 | 20,658 | 38,530 | |
Workforce Unemployed | 108 | 1,433 | 2,442 | |
Civlian Workforce | 2,237 | 22,090 | 40,972 | |
Military Workforce | 0 | 33 | 100 | |
Total Households | 1,699 | 18,378 | 33,343 | |
Family Households | 1,098 | 11,048 | 20,909 | |
Non-Family Households | 601 | 7,329 | 12,434 | |
Married Couple | 656 | 6,687 | 14,265 | |
Other Family | 441 | 4,361 | 6,644 | |
Married w/Child | 229 | 2,288 | 5,376 | |
Single Male w/Child | 43 | 614 | 991 | |
Single Female w/Child | 278 | 1,953 | 2,860 |
Population Change Last Two Decades - Plus Projection
2000 | % | 2010 | % | 2020 | % | 2030 | |
---|---|---|---|---|---|---|---|
Maryland | 5,296,486 | +9 | 5,773,552 | +6 | 6,141,900 | +6 | 6,518,750 |
Frederick County | 195,277 | +20 | 233,385 | +12 | 260,800 | +16 | 303,600 |
Washington County | 131,923 | +12 | 147,430 | +6 | 156,800 | +12 | 175,400 |
West Virginia | 1,808,344 | +2 | 1,852,994 | -1 | 1,828,079 | -1 | 1,806,816 |
Berkeley County | 75,905 | +37 | 104,169 | +14 | 118,838 | +10 | 130,787 |
Total Working Age Population:
Total Households:
Total Working Age Population:
Total Households:
Total Working Age Population:
Total Households: