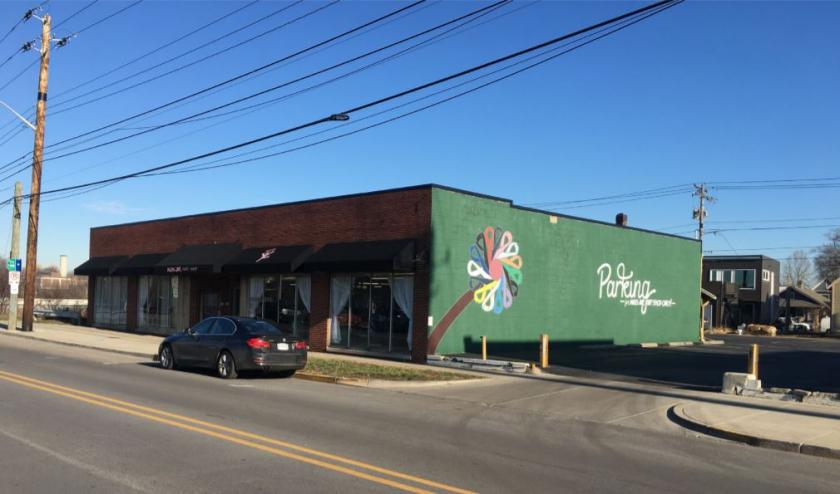
Retail Space
860 Virginia Avenue Indianapolis, IN 46203
860 Virginia Avenue Indianapolis, IN 46203
Details & Description
Property Highlights
- • Highly visible on Virginia Ave
- • Retail or redevelopment opportunity
- • On site parking
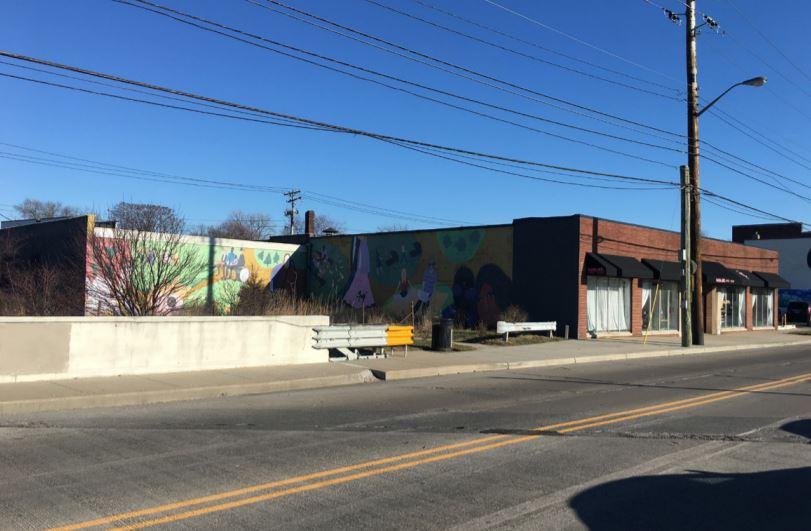
Additional Photos

Listing Agents

Joe Lonnemann
O: 317-566-5624
M: 317-752-3002
jlonnemann@cressy.com
O: 317-566-5624
M: 317-752-3002
jlonnemann@cressy.com
While we strive to provide the most accurate information, all listing information, and demographic data, is provided by third-parties. As such, MyEListing will not be responsible for the accuracy of the information. It is strongly recommended that you verify all information with the listing agent, and any relevant agencies, prior to making any decisions.


