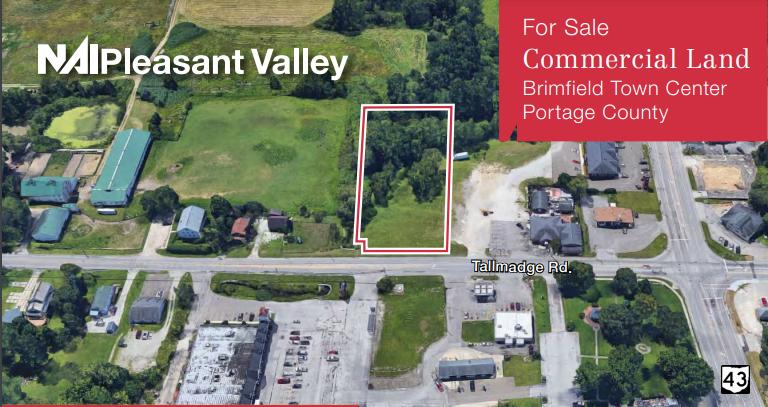
Commercial Land
1263 Tallmadge Rd Kent, OH 44240
1263 Tallmadge Rd Kent, OH 44240
Details & Description
Property Highlights
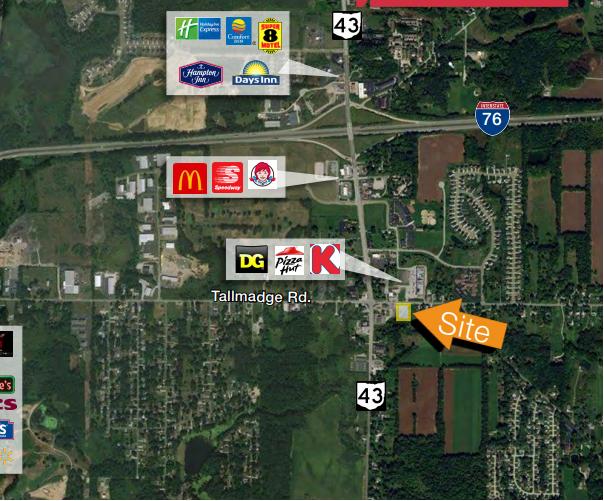
- • 162 Ft. Frontage on Tallmadge Road
- • Close proximity to I-76 Interchange
- • Zoned Commercial
Listing Agents

David Whyte
O: 330-535-2661
M: 303-352-7746
dwhyte@naipvc.com
O: 330-535-2661
M: 303-352-7746
dwhyte@naipvc.com

Karen Whyte
O: 330-535-2661
M: 330-351-1757
karen.whyte@naipvc.com
O: 330-535-2661
M: 330-351-1757
karen.whyte@naipvc.com
While we strive to provide the most accurate information, all listing information, and demographic data, is provided by third-parties. As such, MyEListing will not be responsible for the accuracy of the information. It is strongly recommended that you verify all information with the listing agent, and any relevant agencies, prior to making any decisions.