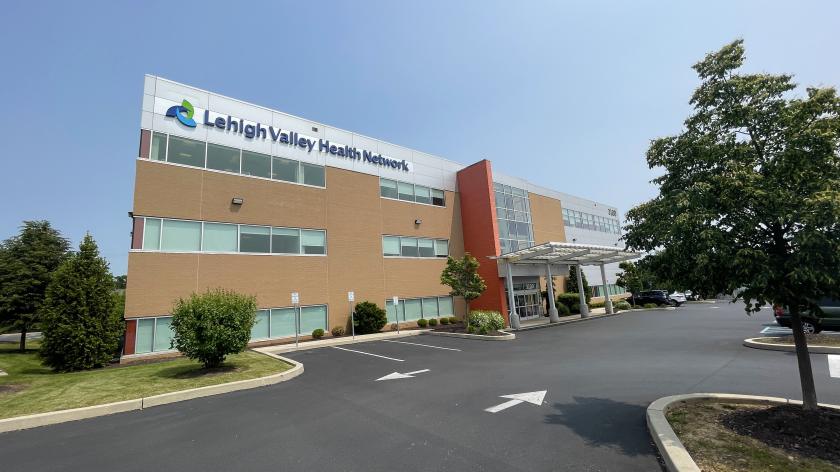
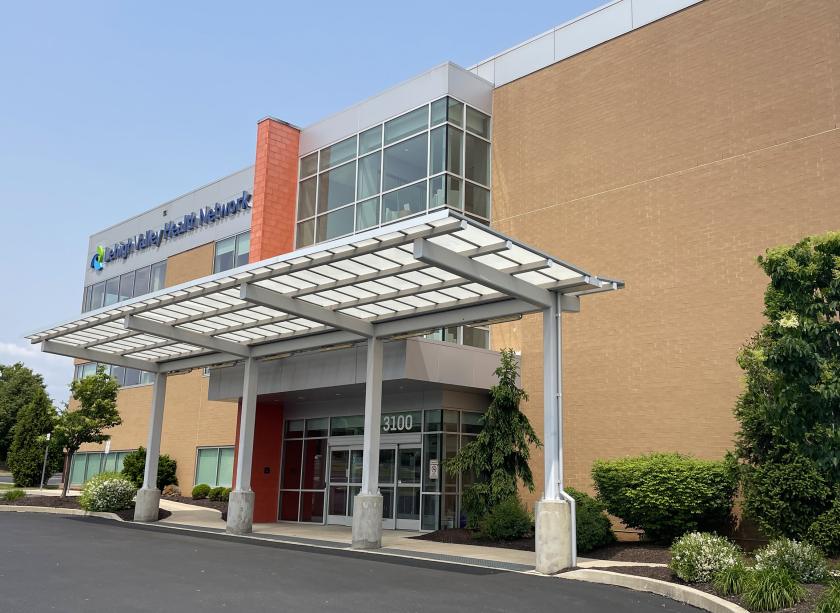
1-Mile | 3-Miles | 5-Miles | ||
---|---|---|---|---|
Total Population | 4,446 | 49,446 | 133,839 | |
Population Median Age | 42 | 43 | 41 | |
Population by Age | 0-9 Yrs | 485 (10%) | 4372 (8%) | 13796 (10%) |
10-19 Yrs | 511 (11%) | 6018 (12%) | 17014 (12%) | |
20-29 Yrs | 538 (12%) | 5345 (10%) | 16105 (12%) | |
30-39 Yrs | 425 (9%) | 5880 (11%) | 16406 (12%) | |
40-49 Yrs | 554 (12%) | 6580 (13%) | 17269 (12%) | |
50-59 Yrs | 752 (16%) | 7805 (15%) | 19256 (14%) | |
60-69 Yrs | 607 (13%) | 6849 (13%) | 17373 (12%) | |
70+ Yrs | 574 (12%) | 6598 (13%) | 16621 (12%) | |
Median HH Income | $101,111 | $82,332 | $70,847 | |
Total Household Income | < 24K | 69 (4%) | 1602 (8%) | 7380 (14%) |
25-49K | 216 (13%) | 3501 (18%) | 10017 (19%) | |
50-74K | 291 (18%) | 3490 (18%) | 9438 (18%) | |
75-99K | 194 (12%) | 2684 (14%) | 7084 (13%) | |
100-199K | 543 (34%) | 5878 (31%) | 12819 (25%) | |
200K+ | 247 (15%) | 1604 (8%) | 3970 (7%) | |
Highest Education Level | No Diploma | 88 | 2394 | 9893 |
Diploma or GED | 835 | 11359 | 30891 | |
Some College | 538 | 6717 | 16055 | |
Assoc. Degree | 254 | 3726 | 8875 | |
Bachelors Degree | 1080 | 8049 | 18742 | |
Higher Degree | 449 | 4472 | 11136 | |
Total Housing Units | 1,643 | 20,044 | 54,975 | |
--Owner-Occupied | 1,470 | 14,727 | 35,122 | |
--Renter-Occupied | 90 | 4,032 | 15,586 | |
Owner-Occupied Values | < 100K | 13 | 548 | 2680 |
100-199K | 214 | 4853 | 12980 | |
200-299K | 650 | 5878 | 10811 | |
300-399K | 480 | 2452 | 5777 | |
400-499K | 71 | 589 | 1602 | |
500K+ | 42 | 407 | 1271 | |
Total Working Age Population | 3,639 | 41,528 | 110,014 | |
In Work Force | 2,565 | 27,654 | 70,894 | |
Not In Work Force | 1,074 | 13,874 | 39,120 | |
Workforce Employed | 2,464 | 26,783 | 67,759 | |
Workforce Unemployed | 101 | 871 | 3,128 | |
Civlian Workforce | 2,565 | 27,654 | 70,887 | |
Military Workforce | 0 | 0 | 7 | |
Total Households | 1,560 | 18,760 | 50,707 | |
Family Households | 1,243 | 13,539 | 35,022 | |
Non-Family Households | 317 | 5,221 | 15,685 | |
Married Couple | 1,078 | 10,912 | 25,719 | |
Other Family | 165 | 2,627 | 9,303 | |
Married w/Child | 352 | 3,833 | 9,039 | |
Single Male w/Child | 13 | 419 | 1,266 | |
Single Female w/Child | 11 | 631 | 3,414 |
Population Change Last Two Decades - Plus Projection
2000 | % | 2010 | % | 2020 | % | 2030 | |
---|---|---|---|---|---|---|---|
New Jersey | 8,414,350 | +4 | 8,791,894 | +4 | 9,132,700 | +4 | 9,530,900 |
Warren County | 102,437 | +6 | 108,692 | -4 | 104,300 | -2 | 102,600 |
Pennsylvania | 12,281,054 | +3 | 12,702,379 | +4 | 13,230,170 | +4 | 13,759,594 |
Bucks County | 597,635 | +5 | 625,249 | +1 | 629,420 | +1 | 637,730 |
Lehigh County | 312,090 | +12 | 349,497 | +5 | 365,909 | +5 | 385,431 |
Northampton County | 267,066 | +11 | 297,735 | +4 | 309,231 | +4 | 321,338 |
Total Working Age Population:
Total Households:
Total Working Age Population:
Total Households:
Total Working Age Population:
Total Households: