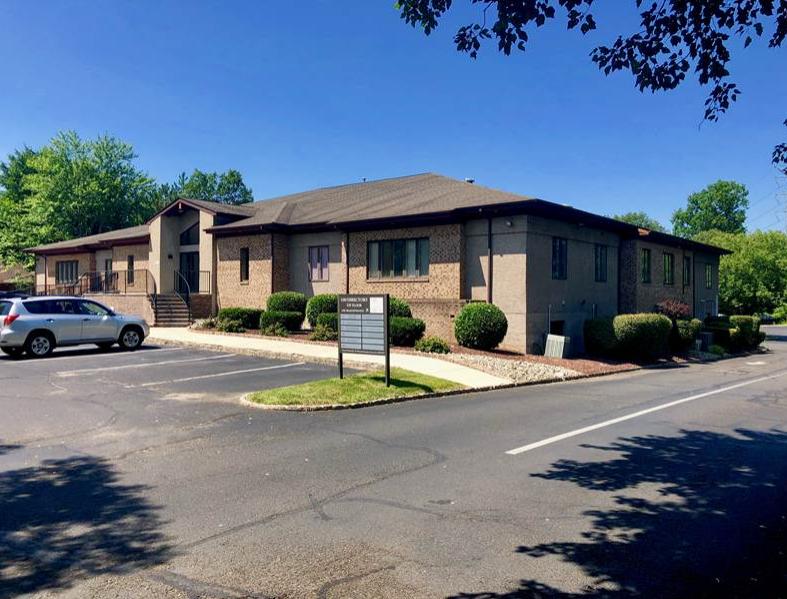
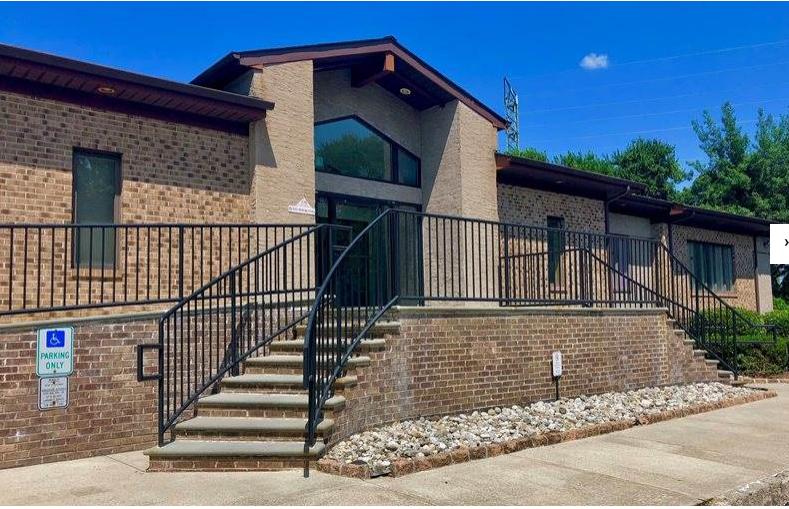
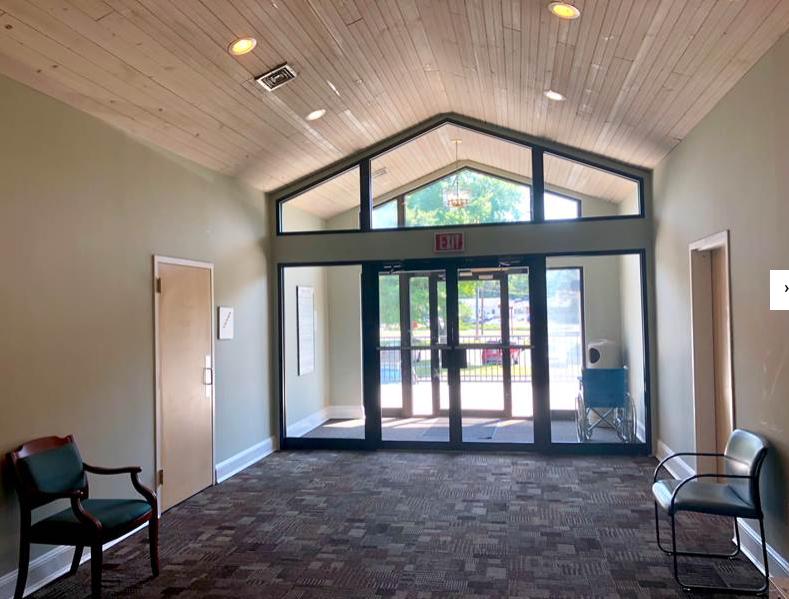
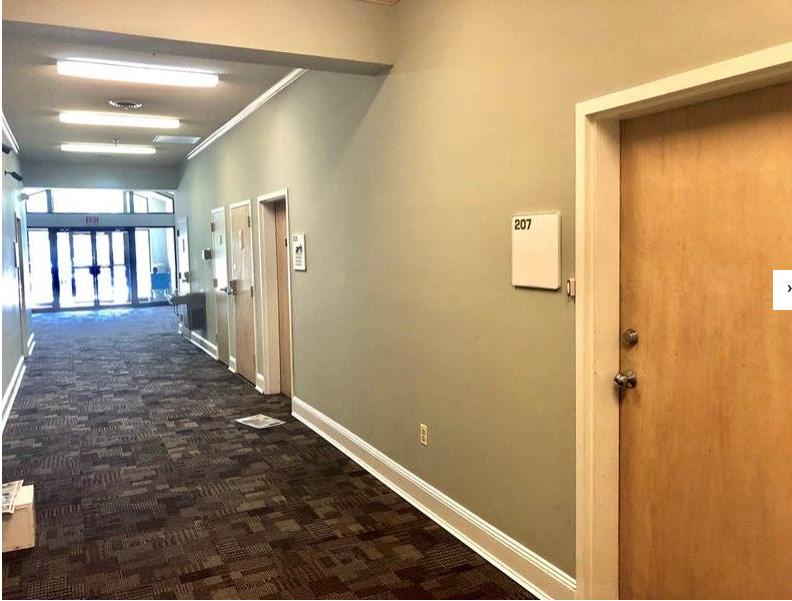
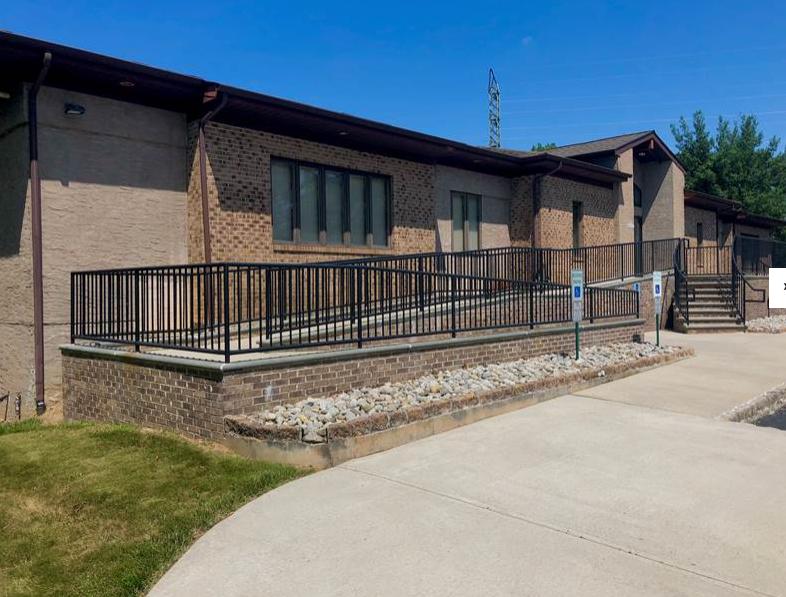
1-Mile | 3-Miles | 5-Miles | ||
---|---|---|---|---|
Total Population | 10,071 | 92,903 | 221,376 | |
Population Median Age | 44 | 40 | 38 | |
Population by Age | 0-9 Yrs | 750 (7%) | 10076 (10%) | 27128 (12%) |
10-19 Yrs | 1075 (10%) | 10592 (11%) | 27737 (12%) | |
20-29 Yrs | 1451 (14%) | 13315 (14%) | 31932 (14%) | |
30-39 Yrs | 1271 (12%) | 12885 (13%) | 30810 (13%) | |
40-49 Yrs | 1045 (10%) | 12344 (13%) | 29531 (13%) | |
50-59 Yrs | 1459 (14%) | 12866 (13%) | 29999 (13%) | |
60-69 Yrs | 1433 (14%) | 11044 (11%) | 23984 (10%) | |
70+ Yrs | 1587 (15%) | 9779 (10%) | 20254 (9%) | |
Median HH Income | $80,817 | $76,613 | $66,940 | |
Total Household Income | < 24K | 546 (13%) | 4599 (13%) | 16541 (20%) |
25-49K | 680 (16%) | 5856 (17%) | 14504 (18%) | |
50-74K | 650 (15%) | 6005 (17%) | 12759 (16%) | |
75-99K | 836 (20%) | 5067 (15%) | 10022 (12%) | |
100-199K | 1128 (27%) | 9581 (28%) | 18858 (23%) | |
200K+ | 302 (7%) | 2466 (7%) | 6580 (8%) | |
Highest Education Level | No Diploma | 610 | 7759 | 22757 |
Diploma or GED | 1980 | 20794 | 45860 | |
Some College | 1658 | 13003 | 28251 | |
Assoc. Degree | 619 | 4780 | 9228 | |
Bachelors Degree | 1765 | 12866 | 26292 | |
Higher Degree | 831 | 6564 | 17975 | |
Total Housing Units | 4,313 | 36,164 | 89,440 | |
--Owner-Occupied | 2,831 | 22,855 | 46,595 | |
--Renter-Occupied | 1,310 | 10,717 | 32,668 | |
Owner-Occupied Values | < 100K | 48 | 2245 | 6805 |
100-199K | 551 | 5452 | 11903 | |
200-299K | 1373 | 8424 | 13648 | |
300-399K | 751 | 4772 | 7785 | |
400-499K | 92 | 1271 | 3087 | |
500K+ | 17 | 691 | 3367 | |
Total Working Age Population | 8,708 | 76,494 | 178,097 | |
In Work Force | 5,775 | 51,640 | 115,901 | |
Not In Work Force | 2,933 | 24,854 | 62,195 | |
Workforce Employed | 5,505 | 48,861 | 107,589 | |
Workforce Unemployed | 270 | 2,695 | 8,193 | |
Civlian Workforce | 5,775 | 51,556 | 115,782 | |
Military Workforce | 0 | 84 | 119 | |
Total Households | 4,141 | 33,572 | 79,264 | |
Family Households | 2,398 | 22,601 | 51,497 | |
Non-Family Households | 1,743 | 10,971 | 27,767 | |
Married Couple | 1,834 | 16,213 | 34,396 | |
Other Family | 564 | 6,389 | 17,101 | |
Married w/Child | 564 | 6,099 | 14,144 | |
Single Male w/Child | 23 | 499 | 1,505 | |
Single Female w/Child | 163 | 2,145 | 6,535 |
Population Change Last Two Decades - Plus Projection
2000 | % | 2010 | % | 2020 | % | 2030 | |
---|---|---|---|---|---|---|---|
New Jersey | 8,414,350 | +4 | 8,791,894 | +4 | 9,132,700 | +4 | 9,530,900 |
Burlington County | 423,394 | +6 | 448,734 | 0 | 450,000 | +3 | 464,900 |
Mercer County | 350,761 | +4 | 366,513 | +3 | 379,000 | +5 | 397,400 |
Middlesex County | 750,162 | +8 | 809,858 | +8 | 873,400 | +7 | 932,200 |
Monmouth County | 615,301 | +2 | 630,380 | 0 | 633,400 | +3 | 655,300 |
Pennsylvania | 12,281,054 | +3 | 12,702,379 | +4 | 13,230,170 | +4 | 13,759,594 |
Bucks County | 597,635 | +5 | 625,249 | +1 | 629,420 | +1 | 637,730 |
Total Working Age Population:
Total Households:
Total Working Age Population:
Total Households:
Total Working Age Population:
Total Households: