Specialty Real Estate
1404 Lead Avenue Southeast Albuquerque, NM 87106
1404 Lead Avenue Southeast Albuquerque, NM 87106

Details & Description
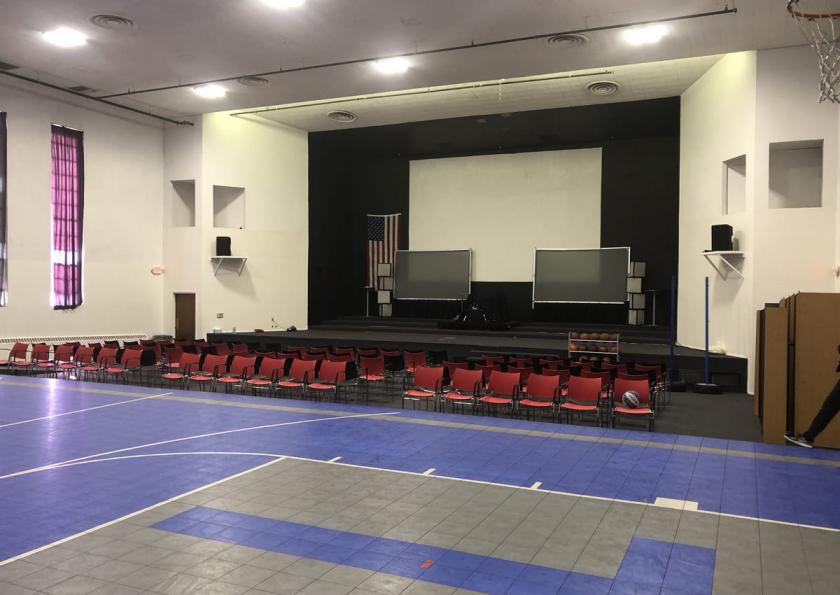
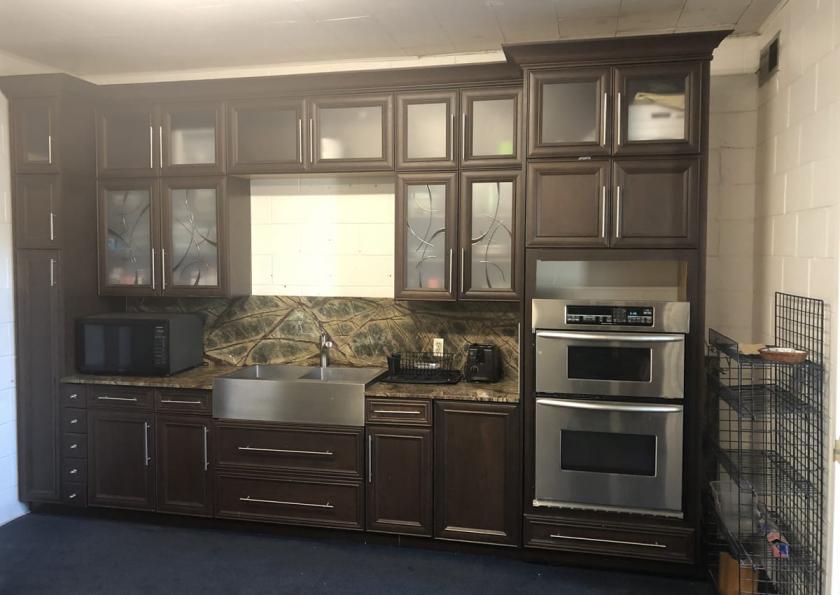
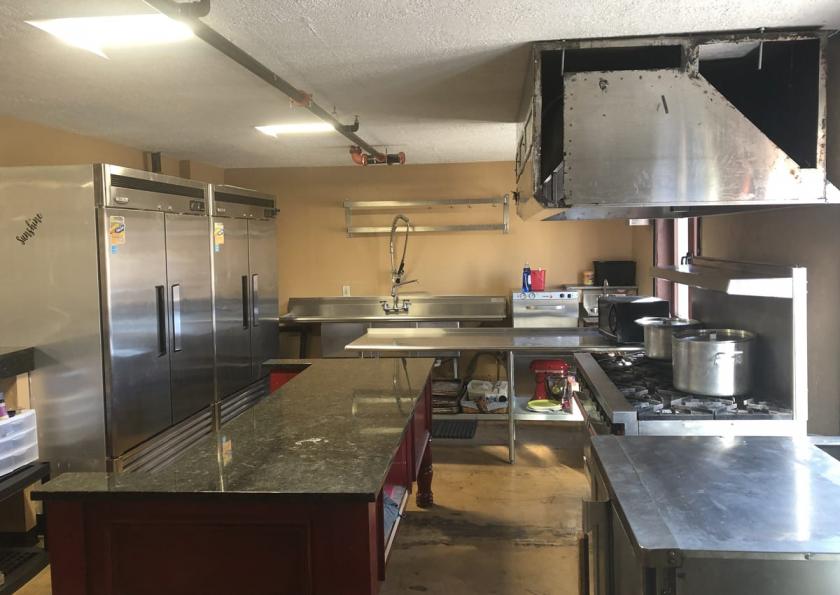
Additional Photos

Listing Agents

Todd Strickland
O: 505-998-5735
M: 505-450-1121
todd@sunvista.com
O: 505-998-5735
M: 505-450-1121
todd@sunvista.com

Danae Fernandez
NAI SunVista
O: 505-338-9873
M: 505-604-8766
danae@sunvista.com
NAI SunVista
O: 505-338-9873
M: 505-604-8766
danae@sunvista.com
While we strive to provide the most accurate information, all listing information, and demographic data, is provided by third-parties. As such, MyEListing will not be responsible for the accuracy of the information. It is strongly recommended that you verify all information with the listing agent, and any relevant agencies, prior to making any decisions.


