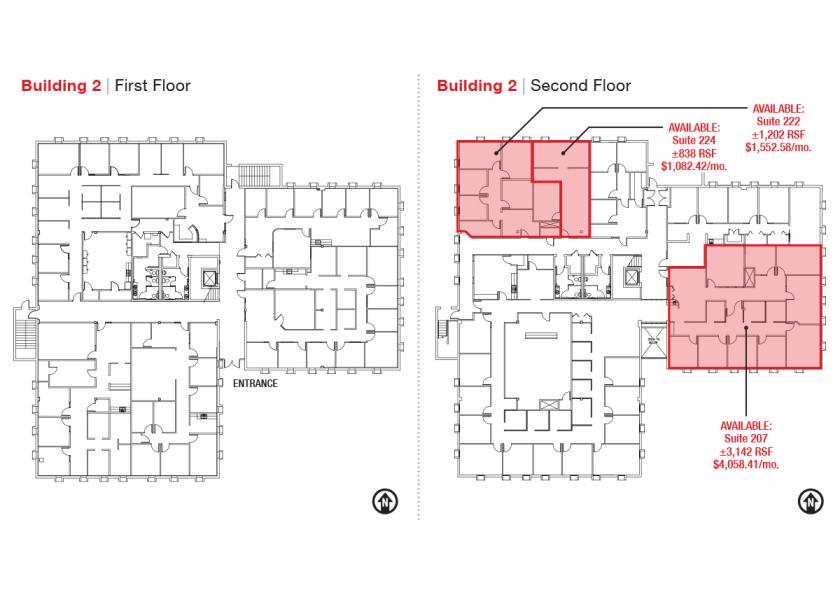
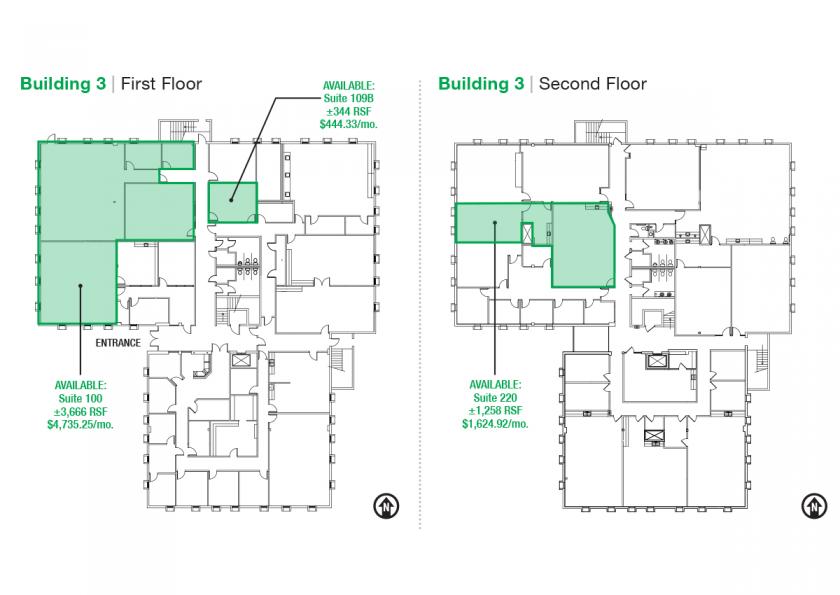
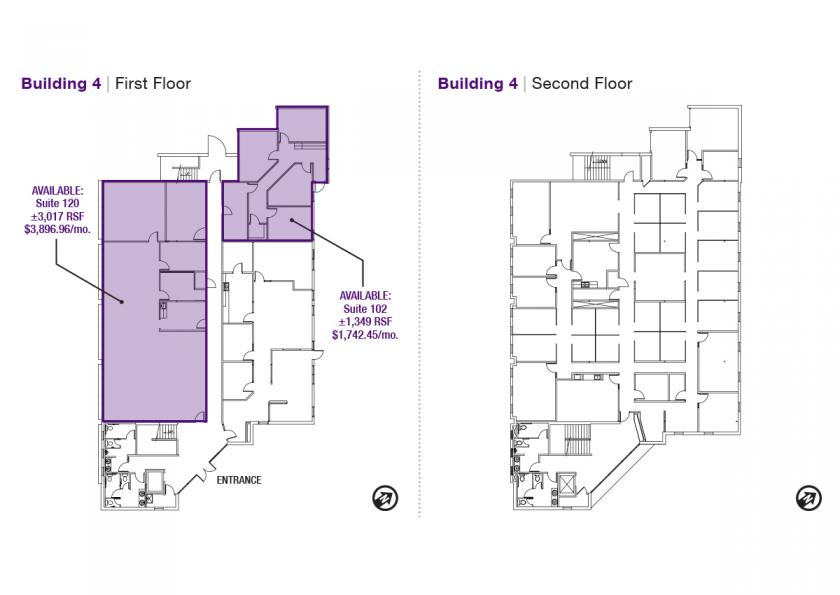
Office Space
2201 San Pedro Drive Northeast Albuquerque, NM 87110
2201 San Pedro Drive Northeast Albuquerque, NM 87110
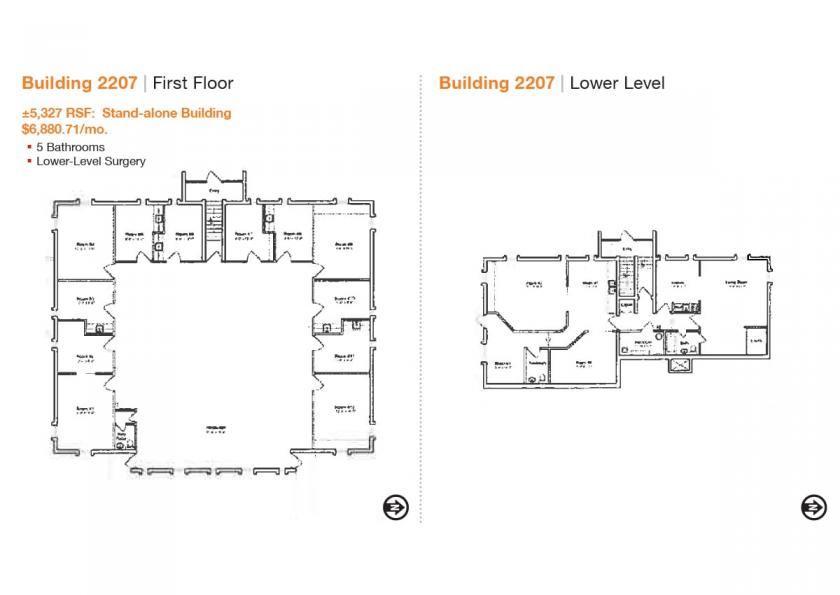
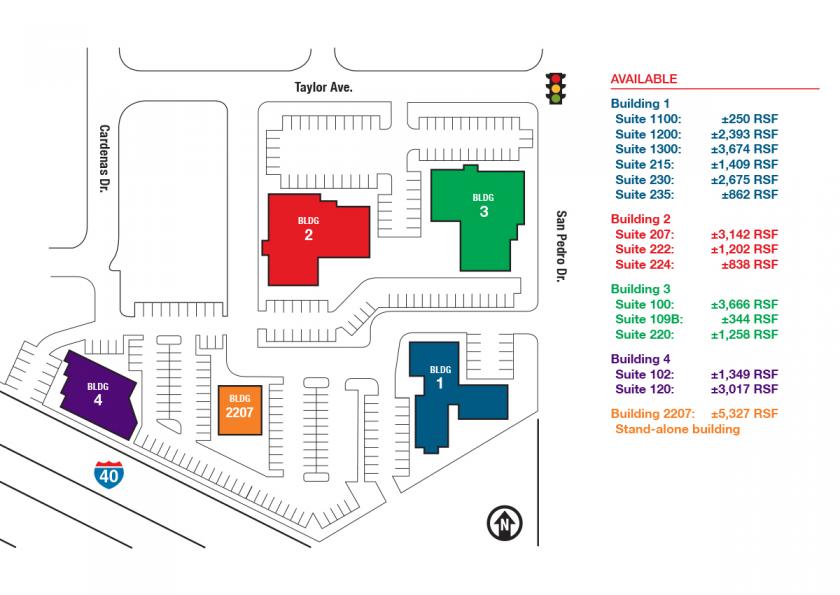
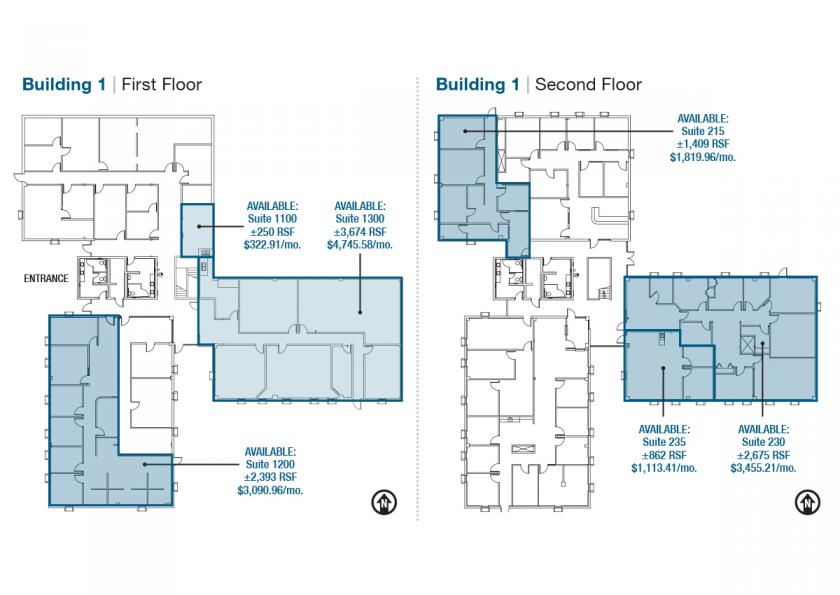
Details & Description
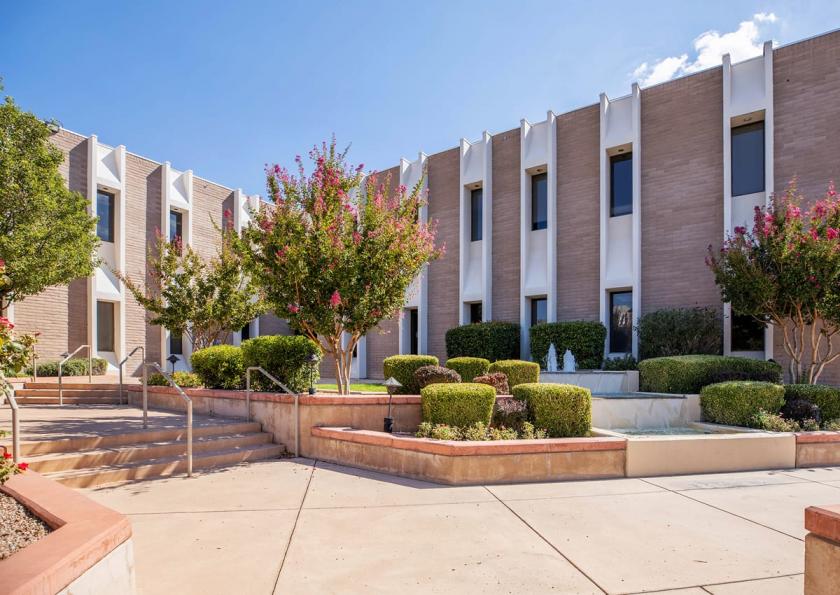
Additional Photos
Listing Agents

Todd Strickland
O: 505-998-5735
M: 505-450-1121
todd@sunvista.com
O: 505-998-5735
M: 505-450-1121
todd@sunvista.com

Martha Carpenter
O: 505-338-9870
M: 505-228-0154
martha@sunvista.com
O: 505-338-9870
M: 505-228-0154
martha@sunvista.com
While we strive to provide the most accurate information, all listing information, and demographic data, is provided by third-parties. As such, MyEListing will not be responsible for the accuracy of the information. It is strongly recommended that you verify all information with the listing agent, and any relevant agencies, prior to making any decisions.