Available
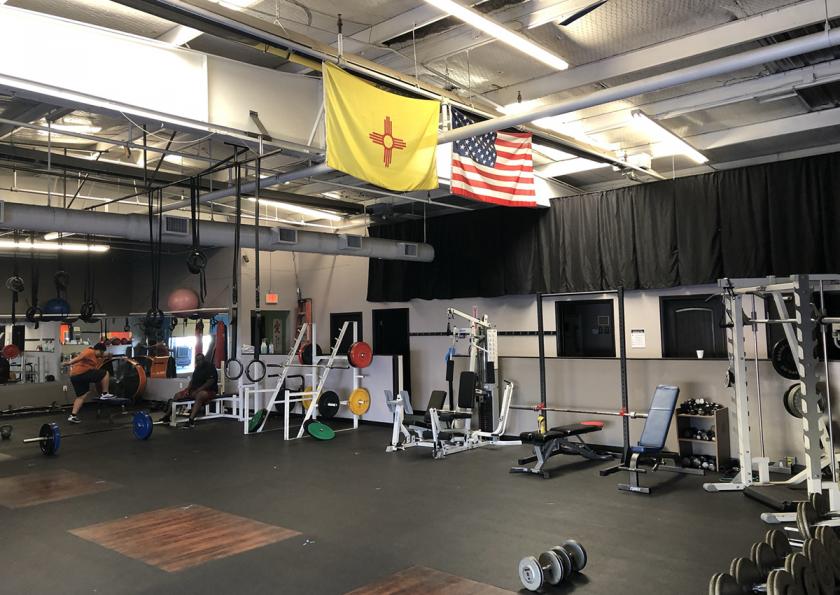
Studio/Warehouse: ±4,665 SF
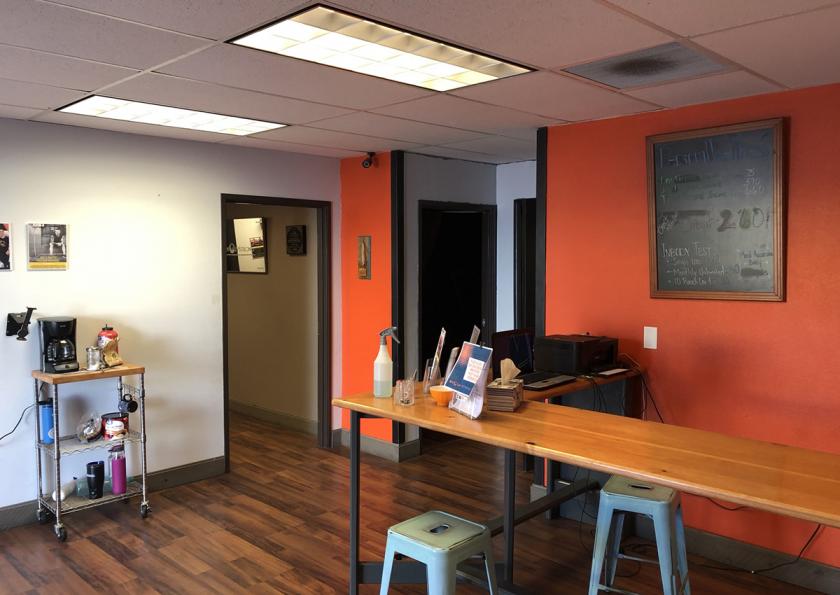
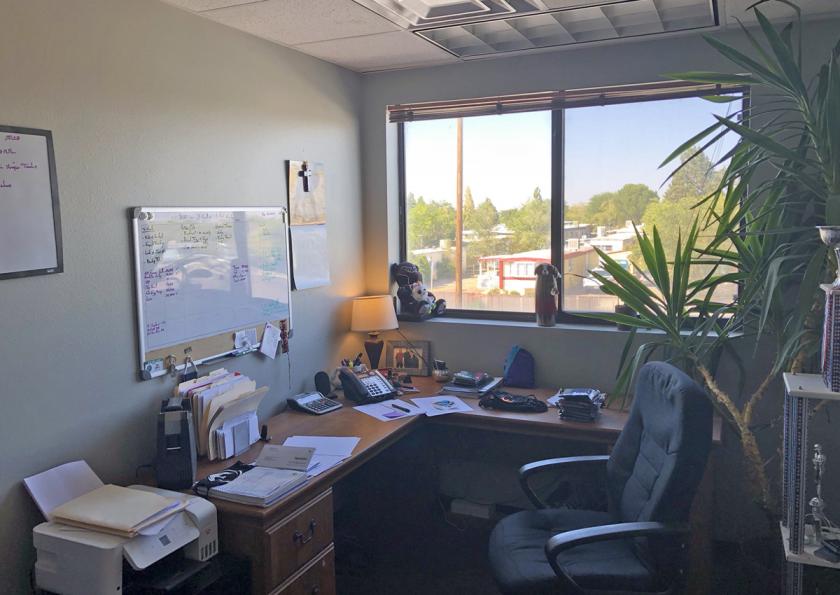
Upstairs Office: ±2,842 SF
Separate Warehouse: ±2,400 SF
TOTAL ±9,907 SF
Property Highlights
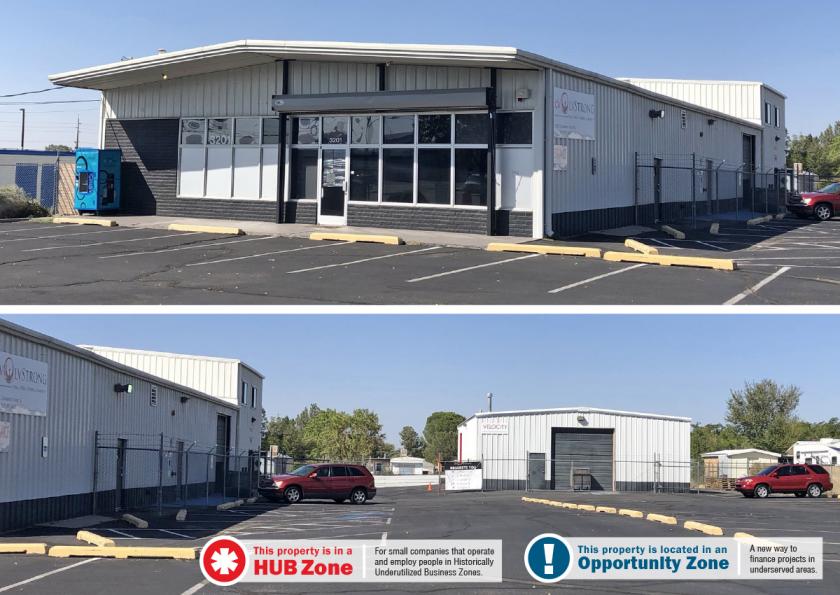
Highly-visible location with 18,300 CPD on Candelaria
2 minutes from I-25 & I-40
62 parking spaces
Main building is fully-sprinkled
Upstairs office, studio & separate warehouse are refrigerated air. Gym is evaporative cooled.
3-phase power throughout
Large monument sign on Candelaria
Tenant in place for 3 years (please do not disturb)
No part of this information may be copied, reproduced, repurposed, or screen-captured for any commercial purpose without prior written authorization from MyEListing.
While we strive to provide the most accurate information, all listing information, and demographic data, is provided by third-parties. As such, MyEListing will not be responsible for the accuracy of the information. It is strongly recommended that you verify all information with the listing agent, and any relevant agencies, prior to making any decisions.
What is the asking price for 3201 Candelaria Road Northeast in Albuquerque?
The asking price for 3201 Candelaria Road Northeast is $1,200,000
What is the building size of this Industrial property in Albuquerque, NM?
The size of the building/unit at 3201 Candelaria Road Northeast in Albuquerque is 9,907 square feet
What kind of Industrial is the propery at 3201 Candelaria Road Northeast?
The property at 3201 Candelaria Road Northeast Albuquerque, NM 87107 is listed as a Warehouse Industrial property
What is the population within 1 mile of 3201 Candelaria Road Northeast in Albuquerque?
The population within 1 mile of 3201 Candelaria Road Northeast Albuquerque, NM 87107 is 9,743 people.
Who do I contact for questions about 3201 Candelaria Road Northeast?
You should contact the listing agent,
Todd Strickland, for any details regarding this commercial listing.