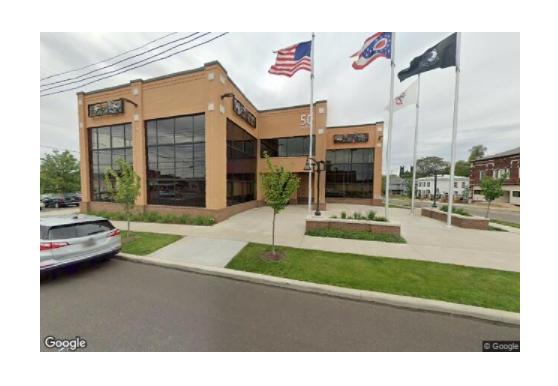
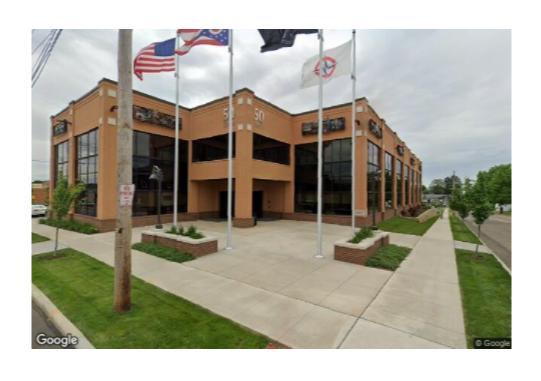
1-Mile | 3-Miles | 5-Miles | ||
---|---|---|---|---|
Total Population | 11,052 | 49,224 | 89,919 | |
Population Median Age | 39 | 41 | 42 | |
Population by Age | 0-9 Yrs | 1507 (13%) | 5714 (11%) | 9725 (10%) |
10-19 Yrs | 1208 (10%) | 6384 (12%) | 11110 (12%) | |
20-29 Yrs | 1681 (15%) | 5675 (11%) | 9708 (10%) | |
30-39 Yrs | 1495 (13%) | 5744 (11%) | 10274 (11%) | |
40-49 Yrs | 1000 (9%) | 5967 (12%) | 11434 (12%) | |
50-59 Yrs | 1448 (13%) | 6334 (12%) | 12439 (13%) | |
60-69 Yrs | 1554 (14%) | 6483 (13%) | 12522 (13%) | |
70+ Yrs | 1159 (10%) | 6924 (14%) | 12707 (14%) | |
Median HH Income | $41,826 | $48,897 | $55,367 | |
Total Household Income | < 24K | 1425 (30%) | 4772 (23%) | 7201 (19%) |
25-49K | 1402 (29%) | 5770 (28%) | 9922 (26%) | |
50-74K | 907 (19%) | 4063 (19%) | 7399 (19%) | |
75-99K | 574 (12%) | 2584 (12%) | 5016 (13%) | |
100-199K | 414 (8%) | 3031 (14%) | 6929 (18%) | |
200K+ | 24 (0%) | 367 (1%) | 1312 (3%) | |
Highest Education Level | No Diploma | 721 | 3179 | 4937 |
Diploma or GED | 3164 | 13967 | 25342 | |
Some College | 1846 | 7716 | 14161 | |
Assoc. Degree | 585 | 2880 | 5598 | |
Bachelors Degree | 854 | 4135 | 8856 | |
Higher Degree | 294 | 2138 | 5318 | |
Total Housing Units | 5,455 | 22,864 | 41,137 | |
--Owner-Occupied | 2,616 | 13,553 | 26,711 | |
--Renter-Occupied | 2,129 | 7,035 | 11,069 | |
Owner-Occupied Values | < 100K | 1704 | 5549 | 8446 |
100-199K | 801 | 6365 | 12919 | |
200-299K | 74 | 1205 | 3344 | |
300-399K | 26 | 249 | 1088 | |
400-499K | 0 | 56 | 388 | |
500K+ | 11 | 129 | 526 | |
Total Working Age Population | 8,869 | 39,806 | 73,585 | |
In Work Force | 5,638 | 24,247 | 45,427 | |
Not In Work Force | 3,231 | 15,559 | 28,158 | |
Workforce Employed | 5,316 | 23,095 | 43,336 | |
Workforce Unemployed | 322 | 1,152 | 2,076 | |
Civlian Workforce | 5,638 | 24,247 | 45,412 | |
Military Workforce | 0 | 0 | 15 | |
Total Households | 4,745 | 20,588 | 37,780 | |
Family Households | 2,599 | 12,642 | 24,128 | |
Non-Family Households | 2,146 | 7,946 | 13,652 | |
Married Couple | 1,630 | 8,892 | 18,044 | |
Other Family | 969 | 3,750 | 6,084 | |
Married w/Child | 528 | 2,993 | 6,019 | |
Single Male w/Child | 192 | 577 | 991 | |
Single Female w/Child | 340 | 1,653 | 2,337 |
Population Change Last Two Decades - Plus Projection
2000 | % | 2010 | % | 2020 | % | 2030 | |
---|---|---|---|---|---|---|---|
Ohio | 11,353,140 | +2 | 11,536,504 | 0 | 11,574,870 | 0 | 11,615,100 |
Stark County | 378,098 | -1 | 375,586 | -2 | 368,210 | -2 | 361,130 |
Total Working Age Population:
Total Households:
Total Working Age Population:
Total Households:
Total Working Age Population:
Total Households: