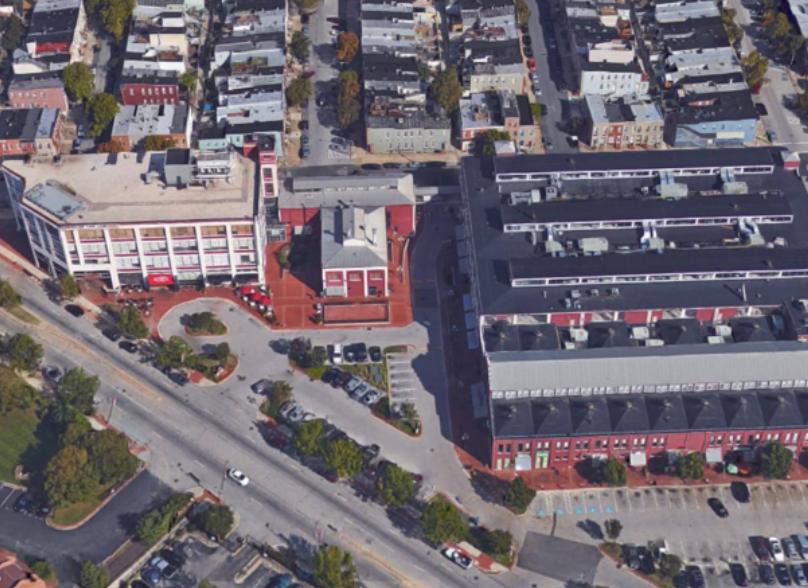
1-Mile | 3-Miles | 5-Miles | ||
---|---|---|---|---|
Total Population | 46,653 | 200,401 | 495,403 | |
Population Median Age | 36 | 36 | 37 | |
Population by Age | 0-9 Yrs | 4412 (9%) | 22923 (11%) | 61557 (12%) |
10-19 Yrs | 1685 (3%) | 18009 (8%) | 54772 (11%) | |
20-29 Yrs | 12229 (26%) | 42521 (21%) | 88768 (17%) | |
30-39 Yrs | 12828 (27%) | 41567 (20%) | 85015 (17%) | |
40-49 Yrs | 5280 (11%) | 21502 (10%) | 53572 (10%) | |
50-59 Yrs | 4698 (10%) | 22666 (11%) | 61620 (12%) | |
60-69 Yrs | 2774 (5%) | 17885 (8%) | 51202 (10%) | |
70+ Yrs | 2747 (5%) | 13328 (6%) | 38898 (7%) | |
Median HH Income | $108,249 | $60,215 | $52,196 | |
Total Household Income | < 24K | 2490 (11%) | 21969 (25%) | 51934 (26%) |
25-49K | 2497 (11%) | 15348 (18%) | 42387 (21%) | |
50-74K | 3330 (15%) | 12883 (15%) | 31208 (16%) | |
75-99K | 2062 (9%) | 8398 (9%) | 21233 (10%) | |
100-199K | 7112 (32%) | 17675 (20%) | 35296 (18%) | |
200K+ | 4670 (21%) | 8918 (10%) | 12885 (6%) | |
Highest Education Level | No Diploma | 2730 | 21717 | 54187 |
Diploma or GED | 3944 | 33560 | 103333 | |
Some College | 3340 | 20435 | 61019 | |
Assoc. Degree | 1140 | 5377 | 15787 | |
Bachelors Degree | 13500 | 34229 | 58697 | |
Higher Degree | 13673 | 30992 | 50830 | |
Total Housing Units | 26,132 | 104,180 | 240,973 | |
--Owner-Occupied | 11,912 | 35,691 | 91,767 | |
--Renter-Occupied | 10,249 | 49,500 | 103,175 | |
Owner-Occupied Values | < 100K | 425 | 7618 | 21819 |
100-199K | 1591 | 8520 | 33946 | |
200-299K | 3746 | 7237 | 18448 | |
300-399K | 2468 | 5266 | 7981 | |
400-499K | 1520 | 2775 | 3815 | |
500K+ | 2163 | 4275 | 5758 | |
Total Working Age Population | 41,228 | 166,252 | 402,507 | |
In Work Force | 33,227 | 111,128 | 254,186 | |
Not In Work Force | 8,001 | 55,124 | 148,321 | |
Workforce Employed | 32,129 | 103,928 | 234,506 | |
Workforce Unemployed | 966 | 6,800 | 18,978 | |
Civlian Workforce | 33,095 | 110,729 | 253,484 | |
Military Workforce | 132 | 399 | 702 | |
Total Households | 22,161 | 85,191 | 194,942 | |
Family Households | 8,440 | 36,074 | 97,456 | |
Non-Family Households | 13,721 | 49,117 | 97,486 | |
Married Couple | 6,578 | 18,939 | 49,367 | |
Other Family | 1,862 | 17,135 | 48,089 | |
Married w/Child | 2,086 | 5,933 | 16,770 | |
Single Male w/Child | 283 | 1,448 | 4,232 | |
Single Female w/Child | 535 | 7,075 | 18,691 |
Population Change Last Two Decades - Plus Projection
2000 | % | 2010 | % | 2020 | % | 2030 | |
---|---|---|---|---|---|---|---|
Maryland | 5,296,486 | +9 | 5,773,552 | +6 | 6,141,900 | +6 | 6,518,750 |
Anne Arundel County | 489,656 | +10 | 537,656 | +7 | 573,250 | +4 | 596,700 |
Baltimore County | 754,292 | +7 | 805,029 | +5 | 847,000 | +2 | 862,200 |
Harford County | 218,590 | +12 | 244,826 | +5 | 257,700 | +5 | 271,850 |
Baltimore city | 651,154 | -5 | 620,961 | -1 | 616,300 | +1 | 625,100 |
Total Working Age Population:
Total Households:
Total Working Age Population:
Total Households:
Total Working Age Population:
Total Households: