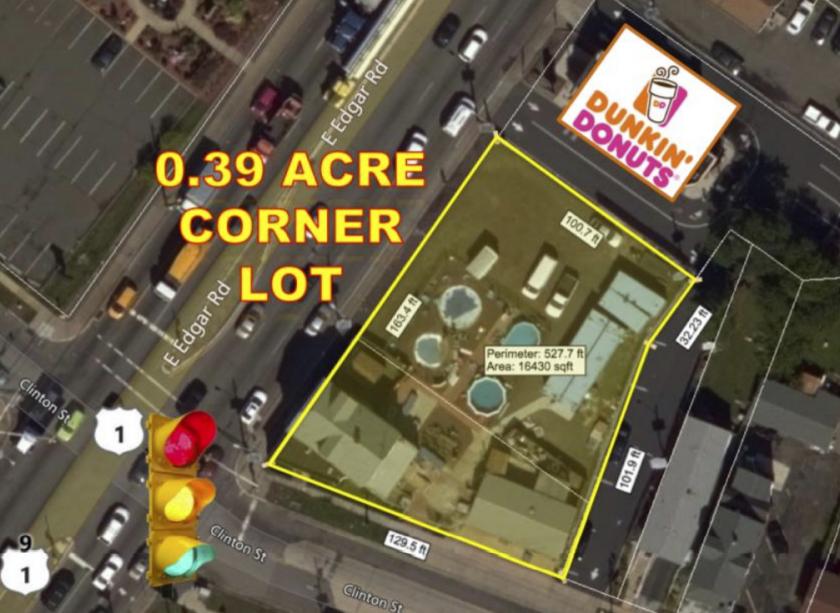
1-Mile | 3-Miles | 5-Miles | ||
---|---|---|---|---|
Total Population | 14,942 | 176,305 | 465,824 | |
Population Median Age | 39 | 38 | 38 | |
Population by Age | 0-9 Yrs | 1837 (12%) | 21690 (12%) | 58920 (12%) |
10-19 Yrs | 1889 (12%) | 22334 (12%) | 60259 (12%) | |
20-29 Yrs | 1922 (12%) | 24635 (13%) | 63217 (13%) | |
30-39 Yrs | 2124 (14%) | 25040 (14%) | 66041 (14%) | |
40-49 Yrs | 1788 (11%) | 25256 (14%) | 62368 (13%) | |
50-59 Yrs | 2343 (15%) | 24790 (14%) | 65377 (14%) | |
60-69 Yrs | 1518 (10%) | 18082 (10%) | 48572 (10%) | |
70+ Yrs | 1522 (10%) | 14477 (8%) | 41071 (8%) | |
Median HH Income | $67,192 | $64,982 | $72,138 | |
Total Household Income | < 24K | 640 (12%) | 10353 (17%) | 26049 (16%) |
25-49K | 1132 (22%) | 12790 (21%) | 29553 (18%) | |
50-74K | 1140 (22%) | 10825 (18%) | 26100 (16%) | |
75-99K | 972 (18%) | 9115 (15%) | 22275 (14%) | |
100-199K | 1092 (21%) | 13779 (23%) | 40921 (25%) | |
200K+ | 148 (2%) | 2763 (4%) | 12803 (8%) | |
Highest Education Level | No Diploma | 1597 | 20099 | 48310 |
Diploma or GED | 3289 | 43792 | 105222 | |
Some College | 2254 | 23173 | 56558 | |
Assoc. Degree | 995 | 7665 | 19188 | |
Bachelors Degree | 1580 | 16812 | 57026 | |
Higher Degree | 747 | 8531 | 30705 | |
Total Housing Units | 5,726 | 64,434 | 169,393 | |
--Owner-Occupied | 2,324 | 28,264 | 86,619 | |
--Renter-Occupied | 2,801 | 31,363 | 71,082 | |
Owner-Occupied Values | < 100K | 86 | 1435 | 2895 |
100-199K | 424 | 4498 | 7839 | |
200-299K | 933 | 11481 | 25833 | |
300-399K | 561 | 7453 | 25384 | |
400-499K | 145 | 2026 | 11365 | |
500K+ | 175 | 1372 | 13305 | |
Total Working Age Population | 12,205 | 141,367 | 370,463 | |
In Work Force | 8,194 | 95,112 | 244,562 | |
Not In Work Force | 4,012 | 46,255 | 125,901 | |
Workforce Employed | 7,581 | 89,274 | 230,672 | |
Workforce Unemployed | 611 | 5,755 | 13,608 | |
Civlian Workforce | 8,192 | 95,029 | 244,280 | |
Military Workforce | 2 | 83 | 281 | |
Total Households | 5,125 | 59,626 | 157,701 | |
Family Households | 3,579 | 41,645 | 113,486 | |
Non-Family Households | 1,546 | 17,981 | 44,215 | |
Married Couple | 1,982 | 25,876 | 76,053 | |
Other Family | 1,596 | 15,769 | 37,433 | |
Married w/Child | 920 | 11,257 | 34,251 | |
Single Male w/Child | 221 | 2,204 | 4,887 | |
Single Female w/Child | 407 | 6,015 | 13,130 |
Population Change Last Two Decades - Plus Projection
2000 | % | 2010 | % | 2020 | % | 2030 | |
---|---|---|---|---|---|---|---|
New Jersey | 8,414,350 | +4 | 8,791,894 | +4 | 9,132,700 | +4 | 9,530,900 |
Essex County | 793,633 | -1 | 783,969 | +3 | 808,300 | +3 | 829,800 |
Hudson County | 608,975 | +4 | 634,266 | +12 | 708,100 | +6 | 747,400 |
Middlesex County | 750,162 | +8 | 809,858 | +8 | 873,400 | +7 | 932,200 |
Morris County | 470,212 | +5 | 492,276 | +3 | 509,100 | +5 | 535,600 |
Union County | 522,541 | +3 | 536,499 | +7 | 573,000 | +6 | 605,600 |
New York | 18,976,457 | +2 | 19,378,102 | +4 | 20,146,131 | +2 | 20,604,030 |
Richmond County | 443,728 | +6 | 468,730 | +3 | 481,351 | +1 | 488,119 |
Total Working Age Population:
Total Households:
Total Working Age Population:
Total Households:
Total Working Age Population:
Total Households: