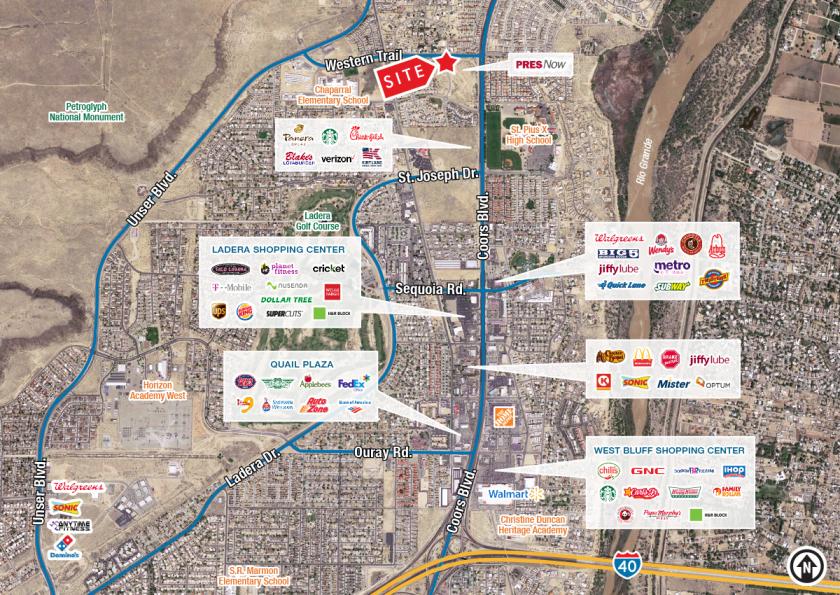
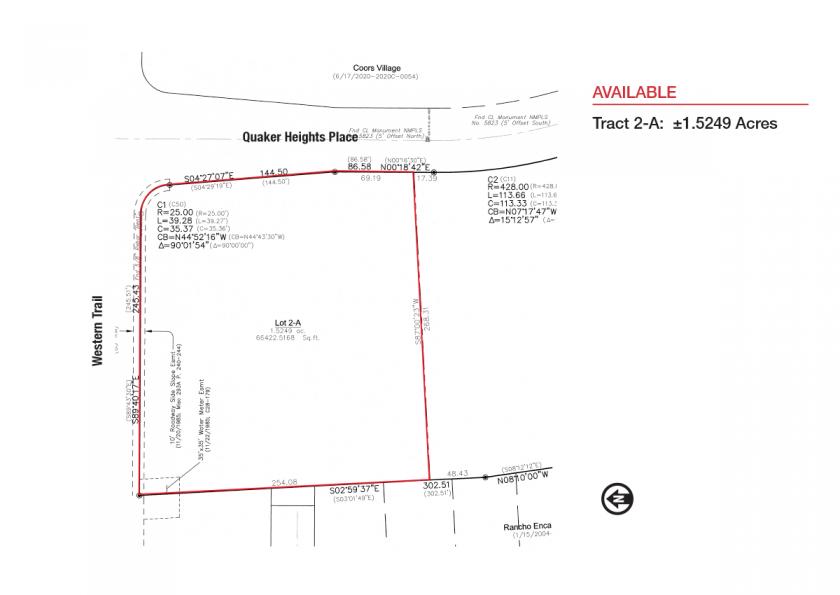
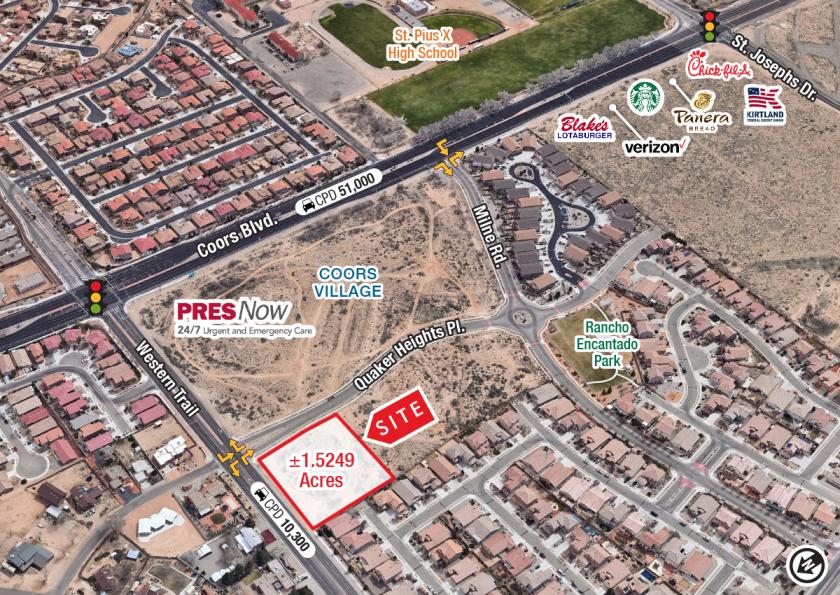
1-Mile | 3-Miles | 5-Miles | ||
---|---|---|---|---|
Total Population | 11,538 | 72,893 | 186,003 | |
Population Median Age | 40 | 40 | 38 | |
Population by Age | 0-9 Yrs | 1209 (10%) | 7954 (10%) | 22002 (11%) |
10-19 Yrs | 1231 (10%) | 9211 (12%) | 24924 (13%) | |
20-29 Yrs | 1352 (11%) | 9757 (13%) | 26527 (14%) | |
30-39 Yrs | 2143 (18%) | 10516 (14%) | 27163 (14%) | |
40-49 Yrs | 1472 (12%) | 8381 (11%) | 21771 (11%) | |
50-59 Yrs | 1455 (12%) | 9797 (13%) | 23900 (12%) | |
60-69 Yrs | 1625 (14%) | 9572 (13%) | 21563 (11%) | |
70+ Yrs | 1050 (9%) | 7706 (10%) | 18154 (9%) | |
Median HH Income | $60,080 | $63,571 | $57,009 | |
Total Household Income | < 24K | 800 (16%) | 5402 (18%) | 16453 (22%) |
25-49K | 1105 (22%) | 5707 (19%) | 15206 (21%) | |
50-74K | 1051 (21%) | 5559 (19%) | 13925 (19%) | |
75-99K | 813 (16%) | 4445 (15%) | 9455 (13%) | |
100-199K | 972 (19%) | 6209 (21%) | 14079 (19%) | |
200K+ | 210 (4%) | 1455 (5%) | 2994 (4%) | |
Highest Education Level | No Diploma | 453 | 4244 | 13807 |
Diploma or GED | 2029 | 12245 | 31173 | |
Some College | 2144 | 12918 | 30317 | |
Assoc. Degree | 775 | 4669 | 11279 | |
Bachelors Degree | 1781 | 9451 | 22767 | |
Higher Degree | 1354 | 7712 | 17328 | |
Total Housing Units | 5,274 | 30,628 | 78,298 | |
--Owner-Occupied | 3,377 | 20,327 | 47,266 | |
--Renter-Occupied | 1,573 | 8,448 | 24,845 | |
Owner-Occupied Values | < 100K | 192 | 1060 | 4297 |
100-199K | 1489 | 9424 | 20898 | |
200-299K | 1084 | 5859 | 13589 | |
300-399K | 287 | 1904 | 4545 | |
400-499K | 172 | 988 | 1792 | |
500K+ | 153 | 1092 | 2144 | |
Total Working Age Population | 9,509 | 59,327 | 148,619 | |
In Work Force | 6,514 | 37,775 | 93,562 | |
Not In Work Force | 2,995 | 21,552 | 55,056 | |
Workforce Employed | 5,942 | 35,373 | 88,047 | |
Workforce Unemployed | 515 | 2,245 | 5,123 | |
Civlian Workforce | 6,457 | 37,618 | 93,169 | |
Military Workforce | 57 | 157 | 393 | |
Total Households | 4,950 | 28,776 | 72,111 | |
Family Households | 3,151 | 18,686 | 43,987 | |
Non-Family Households | 1,799 | 10,089 | 28,124 | |
Married Couple | 2,117 | 12,515 | 29,088 | |
Other Family | 1,034 | 6,171 | 14,899 | |
Married w/Child | 561 | 3,941 | 10,974 | |
Single Male w/Child | 114 | 755 | 1,952 | |
Single Female w/Child | 418 | 2,320 | 5,535 |
Population Change Last Two Decades - Plus Projection
2000 | % | 2010 | % | 2020 | % | 2030 | |
---|---|---|---|---|---|---|---|
New Mexico | 1,819,046 | +13 | 2,059,179 | +6 | 2,187,183 | +6 | 2,308,475 |
Bernalillo County | 556,678 | +19 | 662,564 | +8 | 715,115 | +7 | 763,571 |
Sandoval County | 89,908 | +46 | 131,561 | +13 | 148,708 | +21 | 180,269 |
Total Working Age Population:
Total Households:
Total Working Age Population:
Total Households:
Total Working Age Population:
Total Households: