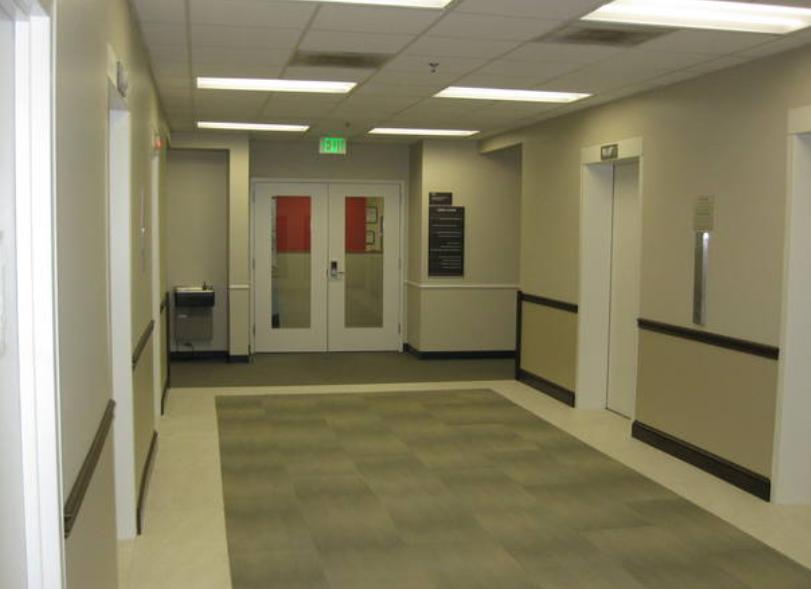
Full floor available - ±27,783 SF
Located in the heart of Towson with easy access to I-695 Beltway, I-83 & I-95
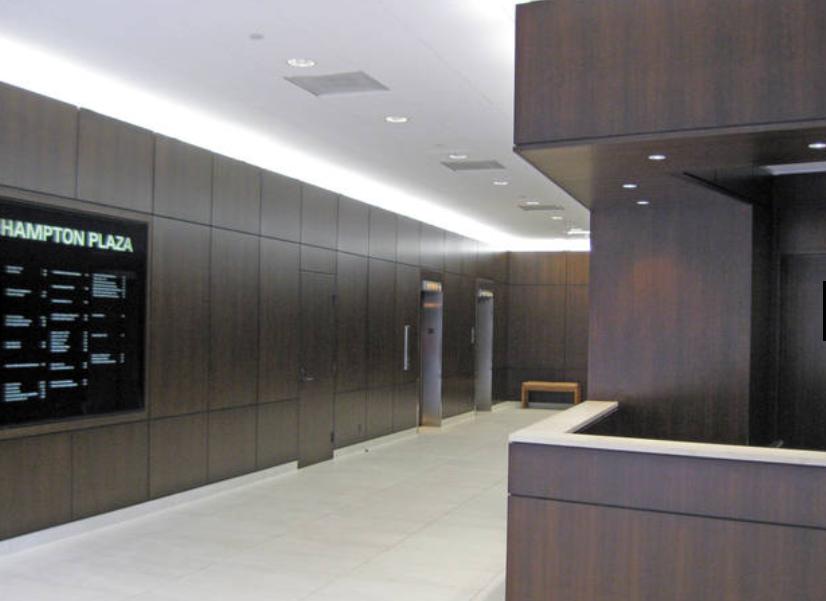
A Towson landmark
11 stories
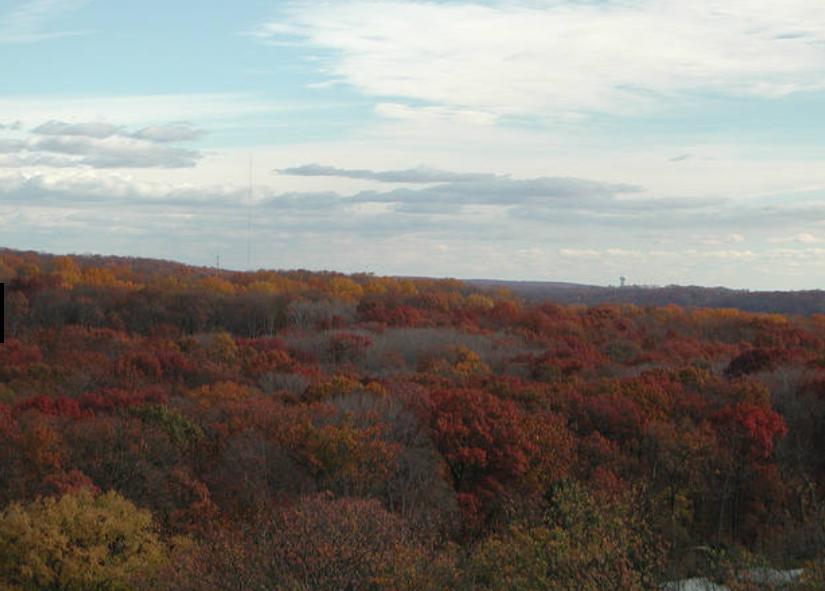
Spectacular views
±325,000 SF
Covered parking
200 Residential apartments
Private walk-bridge to Towson Town Center
Full service lease terms
Building amenities include:
On site management and ownership
Beautifully landscaped courtyard with outdoor tables
Restaurant and catering
High speed Internet
Security (24 hrs per day/7 days per week)
24 hour attended front desk
Auto repair and detailing on site
No part of this information may be copied, reproduced, repurposed, or screen-captured for any commercial purpose without prior written authorization from MyEListing.
While we strive to provide the most accurate information, all listing information, and demographic data, is provided by third-parties. As such, MyEListing will not be responsible for the accuracy of the information. It is strongly recommended that you verify all information with the listing agent, and any relevant agencies, prior to making any decisions.
What is the building size of this commercial Office property?
The size of this lease property at '.300 East Joppa Road.' is 27783 square feet
What kind of Office is the propery at 300 East Joppa Road?
The property at 300 East Joppa Road Baltimore, MD 21286 is listed as a Professional Office property
What is the population within 1 mile of 300 East Joppa Road in Baltimore?
The population within 1 mile of 300 East Joppa Road Baltimore, MD 21286 is 18,971 people.
Who do I contact for questions about 300 East Joppa Road?
You should contact the listing agent,
Joseph Nolan, for any details regarding this commercial listing.