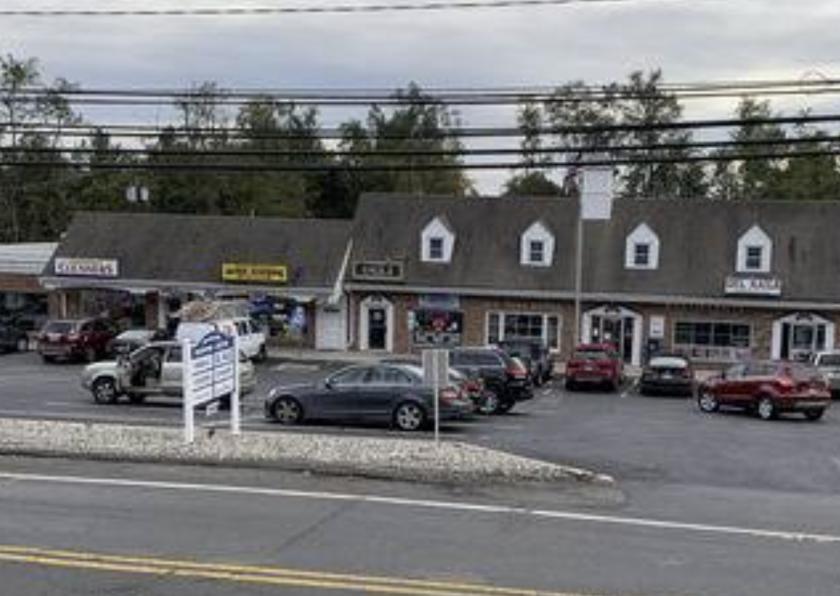
+/- 10,000 SF Shopping Center
Shopping Center has full basement
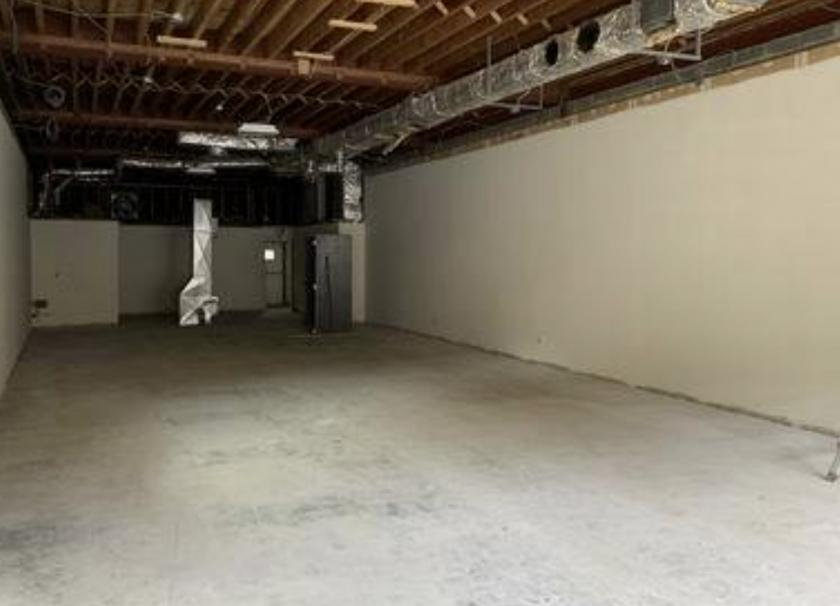
2 End Cap Units - AVAILABLE FOR LEASE
Unit #6 - 1,950 SF End Cap with Drive Up Window
Unit #1 - 1,920 SF End Cap
Excellent retail location.
Tenants include US Post Office, Dry Cleaners, Deli, and Liquor Store
Traffic Count: 12,942 +/- daily
No part of this information may be copied, reproduced, repurposed, or screen-captured for any commercial purpose without prior written authorization from MyEListing.
While we strive to provide the most accurate information, all listing information, and demographic data, is provided by third-parties. As such, MyEListing will not be responsible for the accuracy of the information. It is strongly recommended that you verify all information with the listing agent, and any relevant agencies, prior to making any decisions.
What is the building size of this commercial Retail property?
The size of this lease property at '.1990 Washington Valley Road.' is 1950 square feet
What kind of Retail is the propery at 1990 Washington Valley Road?
The property at 1990 Washington Valley Road Bridgewater Township, NJ 08836 is listed as a Shopping Center Retail property
What is the population within 1 mile of 1990 Washington Valley Road in Bridgewater Township?
The population within 1 mile of 1990 Washington Valley Road Bridgewater Township, NJ 08836 is 2,650 people.
Who do I contact for questions about 1990 Washington Valley Road?
You should contact the listing agent,
John Papanastasiou, for any details regarding this commercial listing.