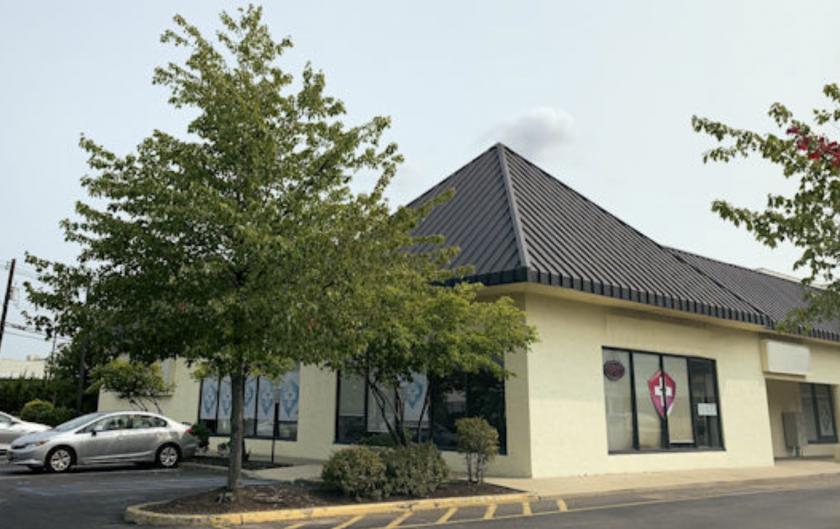
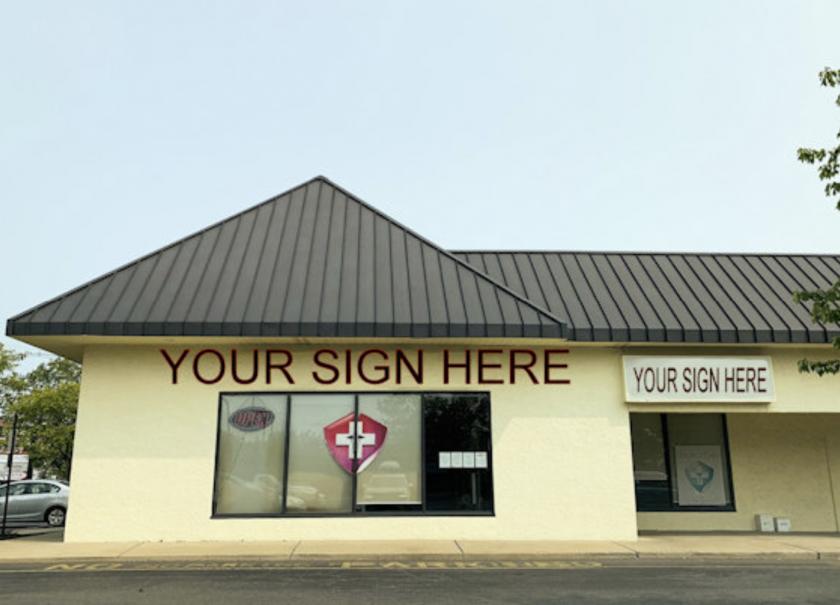
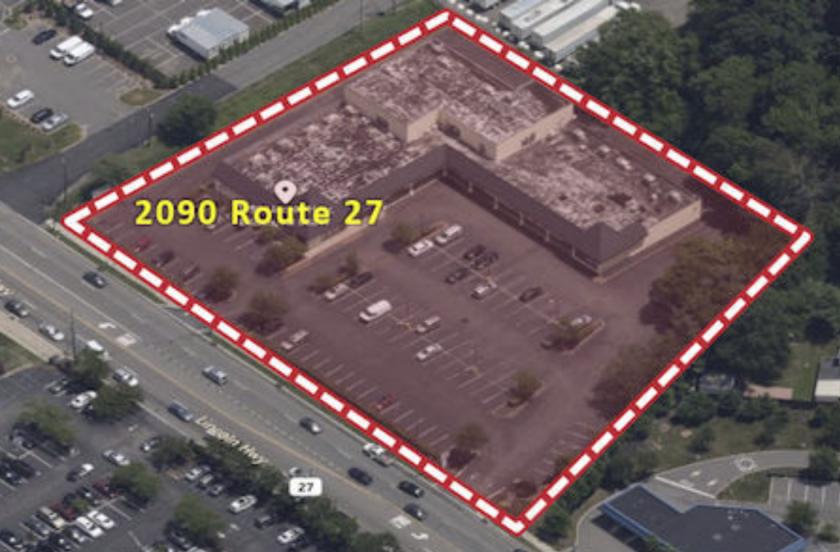
1-Mile | 3-Miles | 5-Miles | ||
---|---|---|---|---|
Total Population | 10,972 | 101,047 | 296,568 | |
Population Median Age | 40 | 38 | 36 | |
Population by Age | 0-9 Yrs | 1370 (12%) | 13157 (13%) | 35772 (12%) |
10-19 Yrs | 1083 (9%) | 11626 (11%) | 40690 (13%) | |
20-29 Yrs | 1094 (9%) | 12757 (12%) | 52139 (17%) | |
30-39 Yrs | 1743 (15%) | 16159 (15%) | 43594 (14%) | |
40-49 Yrs | 1486 (13%) | 13534 (13%) | 36706 (12%) | |
50-59 Yrs | 1783 (16%) | 13948 (13%) | 34893 (11%) | |
60-69 Yrs | 1399 (12%) | 11120 (11%) | 29074 (9%) | |
70+ Yrs | 1013 (9%) | 8746 (8%) | 23700 (7%) | |
Median HH Income | $99,253 | $98,161 | $88,673 | |
Total Household Income | < 24K | 277 (7%) | 3393 (9%) | 13355 (13%) |
25-49K | 538 (14%) | 4981 (13%) | 14156 (14%) | |
50-74K | 459 (12%) | 4976 (13%) | 13456 (14%) | |
75-99K | 607 (16%) | 4941 (13%) | 12756 (13%) | |
100-199K | 1428 (38%) | 11786 (32%) | 29967 (31%) | |
200K+ | 416 (11%) | 5779 (16%) | 12199 (12%) | |
Highest Education Level | No Diploma | 661 | 4498 | 21555 |
Diploma or GED | 2192 | 14201 | 42354 | |
Some College | 1096 | 9301 | 25265 | |
Assoc. Degree | 463 | 4480 | 11366 | |
Bachelors Degree | 2279 | 21089 | 50691 | |
Higher Degree | 1358 | 17557 | 38990 | |
Total Housing Units | 3,916 | 37,721 | 102,023 | |
--Owner-Occupied | 2,751 | 21,515 | 54,057 | |
--Renter-Occupied | 974 | 14,341 | 41,833 | |
Owner-Occupied Values | < 100K | 51 | 823 | 1572 |
100-199K | 203 | 1318 | 3802 | |
200-299K | 910 | 4598 | 13895 | |
300-399K | 953 | 6606 | 16901 | |
400-499K | 444 | 3996 | 8947 | |
500K+ | 191 | 4173 | 8940 | |
Total Working Age Population | 8,832 | 80,903 | 241,483 | |
In Work Force | 6,018 | 55,020 | 149,243 | |
Not In Work Force | 2,814 | 25,883 | 92,241 | |
Workforce Employed | 5,595 | 52,085 | 141,030 | |
Workforce Unemployed | 410 | 2,888 | 8,165 | |
Civlian Workforce | 6,005 | 54,972 | 149,195 | |
Military Workforce | 13 | 48 | 48 | |
Total Households | 3,725 | 35,856 | 95,889 | |
Family Households | 2,920 | 26,249 | 68,968 | |
Non-Family Households | 806 | 9,607 | 26,922 | |
Married Couple | 2,408 | 20,671 | 52,476 | |
Other Family | 512 | 5,578 | 16,492 | |
Married w/Child | 1,163 | 10,086 | 25,170 | |
Single Male w/Child | 10 | 339 | 1,747 | |
Single Female w/Child | 112 | 1,938 | 5,338 |
Population Change Last Two Decades - Plus Projection
2000 | % | 2010 | % | 2020 | % | 2030 | |
---|---|---|---|---|---|---|---|
New Jersey | 8,414,350 | +4 | 8,791,894 | +4 | 9,132,700 | +4 | 9,530,900 |
Middlesex County | 750,162 | +8 | 809,858 | +8 | 873,400 | +7 | 932,200 |
Monmouth County | 615,301 | +2 | 630,380 | 0 | 633,400 | +3 | 655,300 |
Somerset County | 297,490 | +9 | 323,444 | +6 | 342,900 | +7 | 366,700 |
Union County | 522,541 | +3 | 536,499 | +7 | 573,000 | +6 | 605,600 |
Total Working Age Population:
Total Households:
Total Working Age Population:
Total Households:
Total Working Age Population:
Total Households: