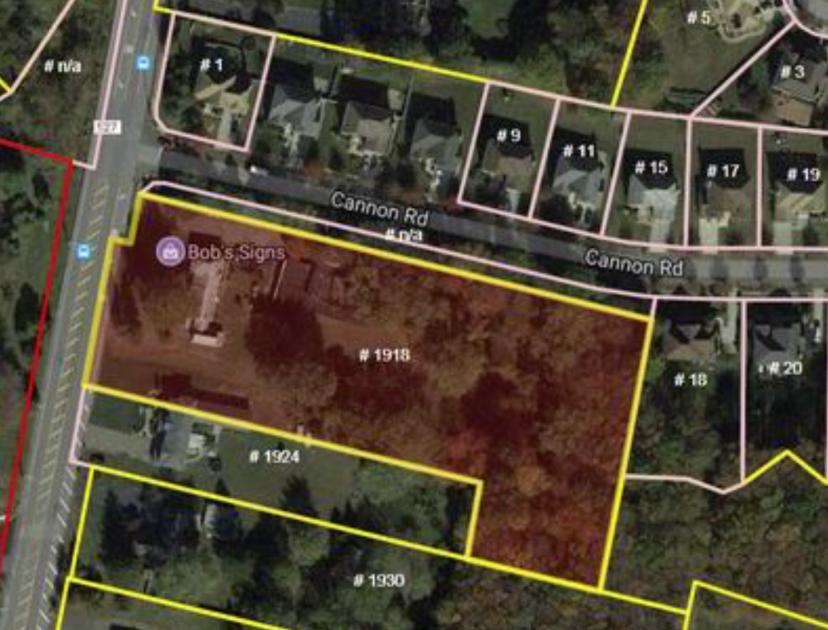
1-Mile | 3-Miles | 5-Miles | ||
---|---|---|---|---|
Total Population | 2,132 | 35,530 | 120,666 | |
Population Median Age | 42 | 42 | 42 | |
Population by Age | 0-9 Yrs | 189 (8%) | 3841 (10%) | 13596 (11%) |
10-19 Yrs | 301 (14%) | 4645 (13%) | 14689 (12%) | |
20-29 Yrs | 208 (9%) | 3730 (10%) | 12034 (9%) | |
30-39 Yrs | 218 (10%) | 3198 (9%) | 12101 (10%) | |
40-49 Yrs | 337 (15%) | 4946 (13%) | 17554 (14%) | |
50-59 Yrs | 303 (14%) | 5704 (16%) | 18294 (15%) | |
60-69 Yrs | 311 (14%) | 4826 (13%) | 16565 (13%) | |
70+ Yrs | 265 (12%) | 4641 (13%) | 15832 (13%) | |
Median HH Income | $157,051 | $114,093 | $109,530 | |
Total Household Income | < 24K | 52 (6%) | 1432 (11%) | 4493 (10%) |
25-49K | 60 (8%) | 1479 (11%) | 5459 (12%) | |
50-74K | 54 (7%) | 1514 (11%) | 5421 (12%) | |
75-99K | 71 (9%) | 1245 (9%) | 4588 (10%) | |
100-199K | 235 (31%) | 3995 (31%) | 14835 (34%) | |
200K+ | 278 (37%) | 2999 (23%) | 8589 (19%) | |
Highest Education Level | No Diploma | 96 | 1539 | 4891 |
Diploma or GED | 272 | 5963 | 21125 | |
Some College | 233 | 4074 | 13969 | |
Assoc. Degree | 97 | 1963 | 6357 | |
Bachelors Degree | 575 | 7204 | 25144 | |
Higher Degree | 273 | 4415 | 15016 | |
Total Housing Units | 778 | 13,144 | 45,311 | |
--Owner-Occupied | 593 | 10,322 | 36,523 | |
--Renter-Occupied | 157 | 2,341 | 6,863 | |
Owner-Occupied Values | < 100K | 7 | 193 | 836 |
100-199K | 6 | 1025 | 2703 | |
200-299K | 16 | 910 | 5761 | |
300-399K | 67 | 1659 | 8816 | |
400-499K | 98 | 2088 | 7164 | |
500K+ | 400 | 4448 | 11244 | |
Total Working Age Population | 1,759 | 28,716 | 97,527 | |
In Work Force | 1,128 | 17,730 | 61,937 | |
Not In Work Force | 631 | 10,987 | 35,590 | |
Workforce Employed | 1,066 | 16,918 | 59,094 | |
Workforce Unemployed | 62 | 812 | 2,824 | |
Civlian Workforce | 1,128 | 17,730 | 61,918 | |
Military Workforce | 0 | 0 | 19 | |
Total Households | 750 | 12,663 | 43,386 | |
Family Households | 611 | 9,604 | 32,918 | |
Non-Family Households | 138 | 3,059 | 10,468 | |
Married Couple | 547 | 8,294 | 28,677 | |
Other Family | 64 | 1,310 | 4,241 | |
Married w/Child | 208 | 3,347 | 11,878 | |
Single Male w/Child | 6 | 73 | 309 | |
Single Female w/Child | 12 | 314 | 1,057 |
Population Change Last Two Decades - Plus Projection
2000 | % | 2010 | % | 2020 | % | 2030 | |
---|---|---|---|---|---|---|---|
New Jersey | 8,414,350 | +4 | 8,791,894 | +4 | 9,132,700 | +4 | 9,530,900 |
Middlesex County | 750,162 | +8 | 809,858 | +8 | 873,400 | +7 | 932,200 |
Monmouth County | 615,301 | +2 | 630,380 | 0 | 633,400 | +3 | 655,300 |
Somerset County | 297,490 | +9 | 323,444 | +6 | 342,900 | +7 | 366,700 |
Total Working Age Population:
Total Households:
Total Working Age Population:
Total Households:
Total Working Age Population:
Total Households: