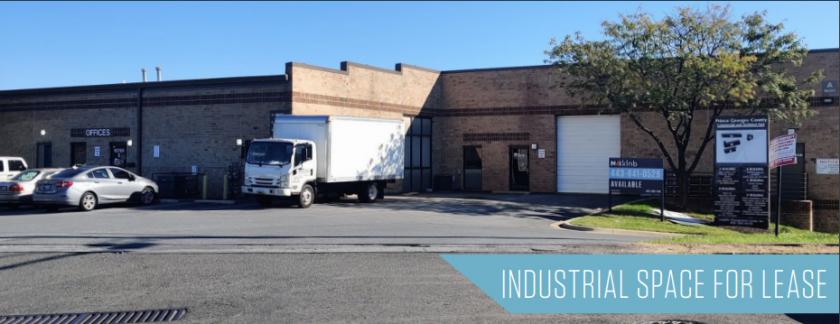
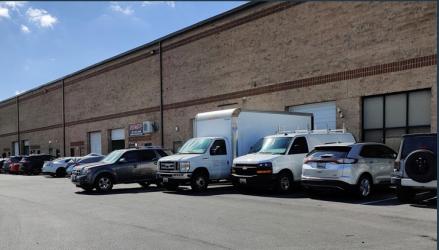
Flex-Office-Warehouse
10780 Hanna Street Beltsville, MD 20705
10780 Hanna Street Beltsville, MD 20705
Details & Description
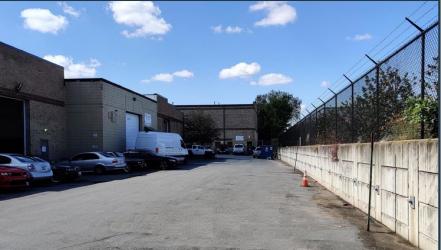
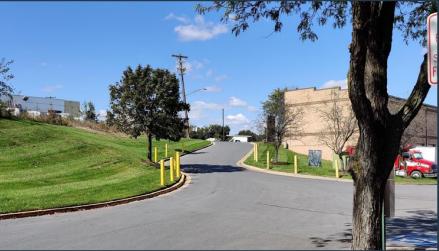
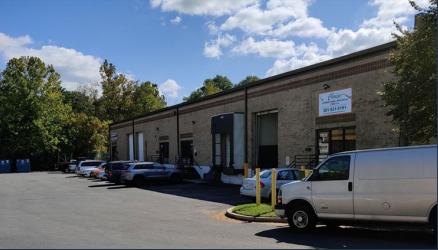
Additional Photos
Listing Agents

Michael Royce
O: 703-268-2741
M: 301-675-7273
mroyce@klnb.com
O: 703-268-2741
M: 301-675-7273
mroyce@klnb.com

Colin Dempsey
O: 443-574-1409
M: 443-841-0529
cdempsey@klnb.com
O: 443-574-1409
M: 443-841-0529
cdempsey@klnb.com
While we strive to provide the most accurate information, all listing information, and demographic data, is provided by third-parties. As such, MyEListing will not be responsible for the accuracy of the information. It is strongly recommended that you verify all information with the listing agent, and any relevant agencies, prior to making any decisions.


