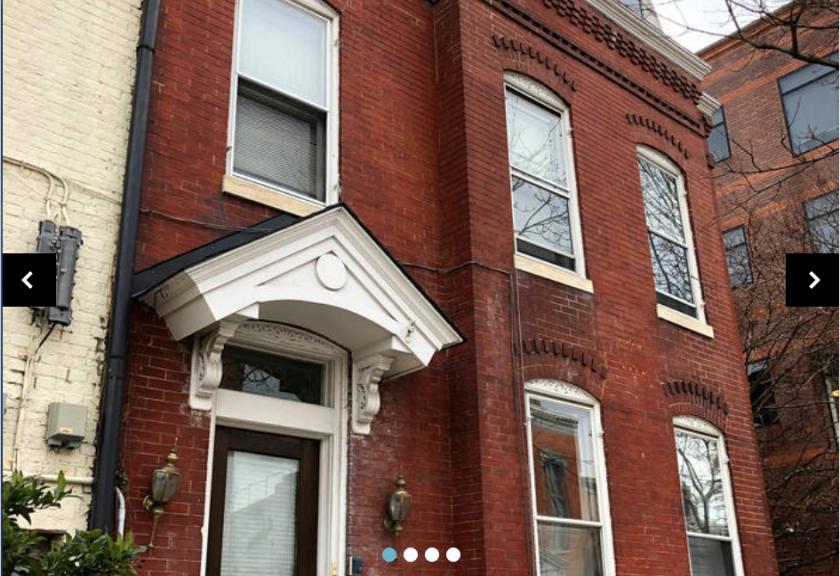
One of a kind building located 1 block of King Street in Old Town Alexandria
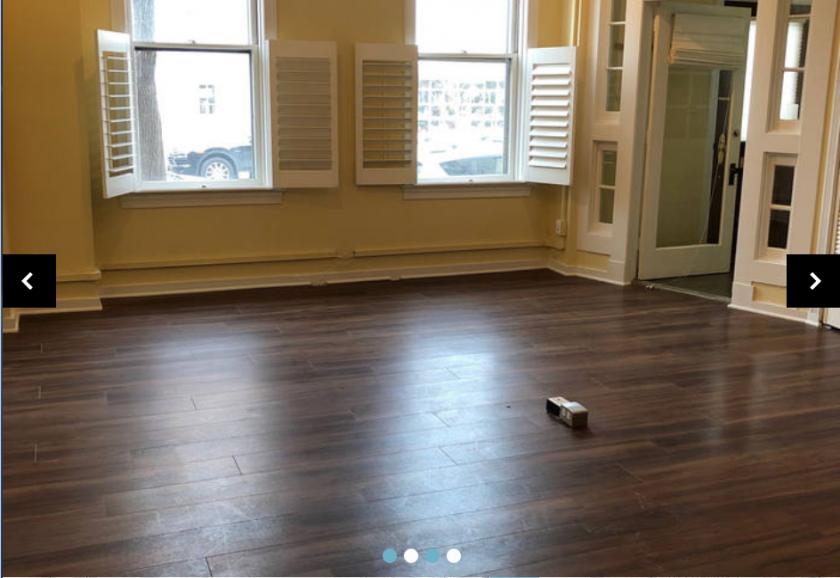
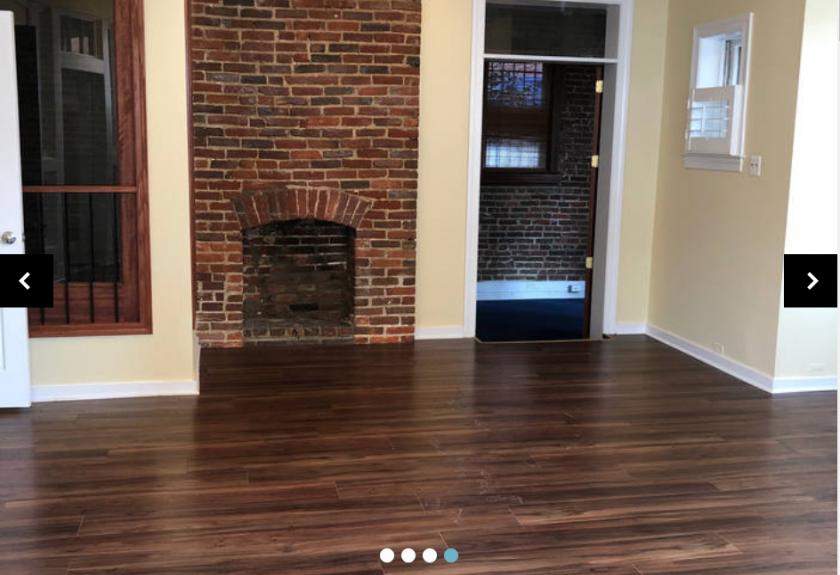
Approxamately 3,072 SF on three (3) floors and lower level
1st floor has two (2) entrances and can be used as retail or office space
Surrounded by an abundance of King Street restaurants and shopping
Perfect opportunity for office user or residential conversion
Each floor contains its own bathrooms and kitchens so the building can be easily leased to 3rd party tenants.
Underground parking in adjacent building.
Opportunity for signage/branding facing Alfred & King Streets.
No part of this information may be copied, reproduced, repurposed, or screen-captured for any commercial purpose without prior written authorization from MyEListing.
While we strive to provide the most accurate information, all listing information, and demographic data, is provided by third-parties. As such, MyEListing will not be responsible for the accuracy of the information. It is strongly recommended that you verify all information with the listing agent, and any relevant agencies, prior to making any decisions.
What is the asking price for 102 South Alfred Street in Alexandria?
The asking price for 102 South Alfred Street is $1,200,000
What is the building size of this Office property in Alexandria, VA?
The size of the building/unit at 102 South Alfred Street in Alexandria is 3,072 square feet
What kind of Office is the propery at 102 South Alfred Street?
The property at 102 South Alfred Street Alexandria, VA 22314 is listed as a Professional Office property
What is the population within 1 mile of 102 South Alfred Street in Alexandria?
The population within 1 mile of 102 South Alfred Street Alexandria, VA 22314 is 29,381 people.
Who do I contact for questions about 102 South Alfred Street?
You should contact the listing agent,
Jack Regler, for any details regarding this commercial listing.