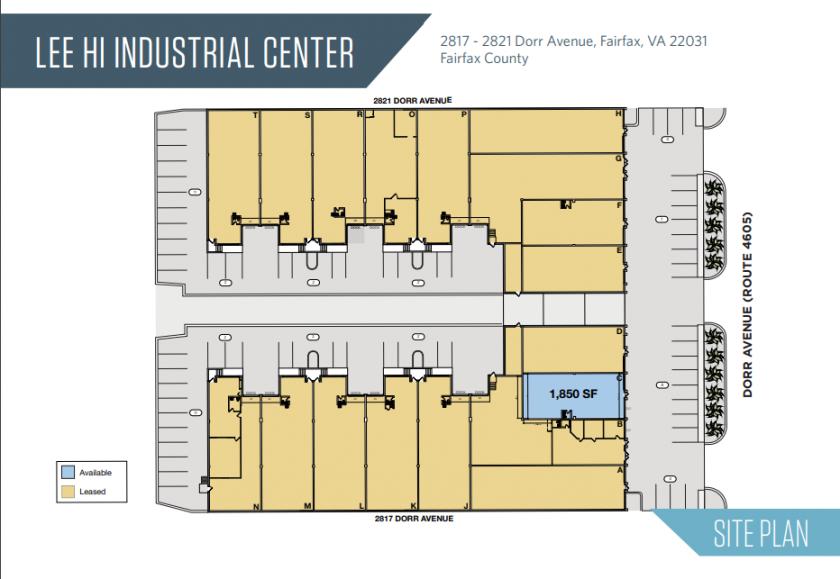
Flex-Office-Warehouse
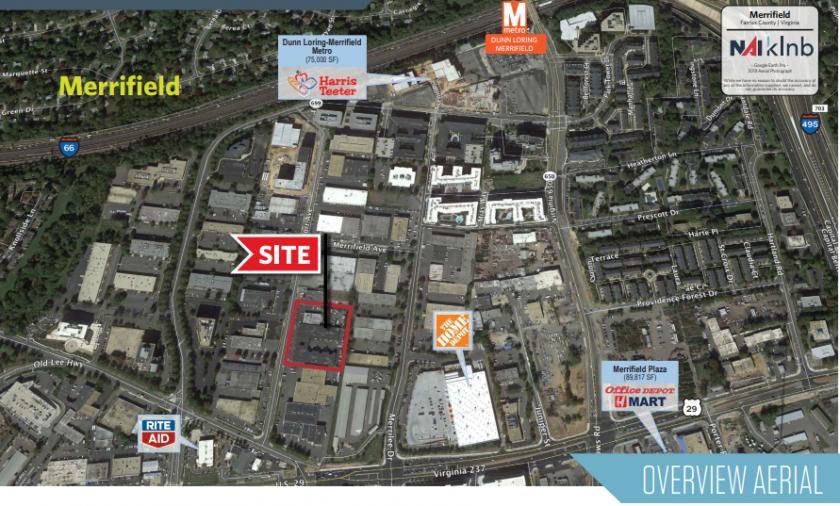
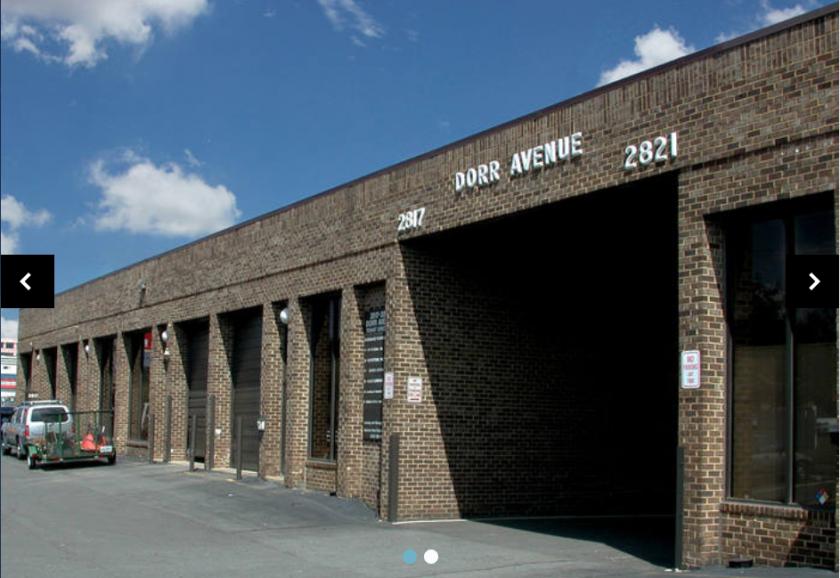
2832 Dorr Avenue Fairfax, VA 22031
2832 Dorr Avenue Fairfax, VA 22031
Details & Description
Listing Agents

Ryan Moody
O: 703-268-2739
M: 301-980-9595
rmoody@klnb.com
O: 703-268-2739
M: 301-980-9595
rmoody@klnb.com
While we strive to provide the most accurate information, all listing information, and demographic data, is provided by third-parties. As such, MyEListing will not be responsible for the accuracy of the information. It is strongly recommended that you verify all information with the listing agent, and any relevant agencies, prior to making any decisions.