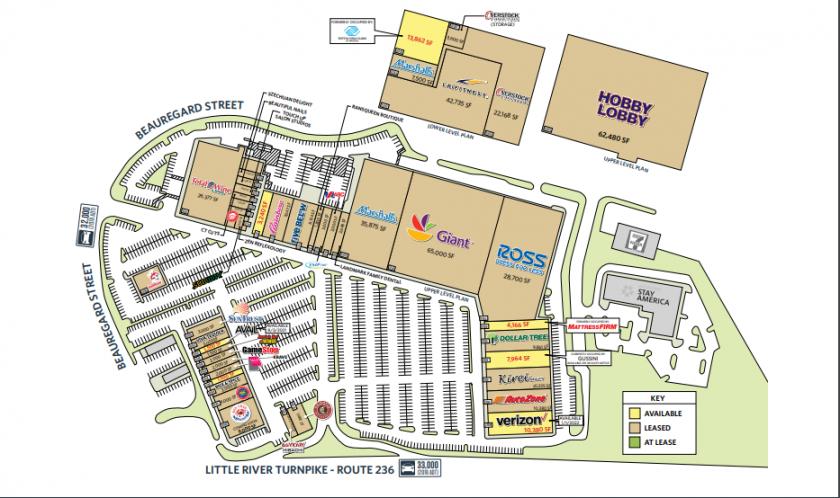
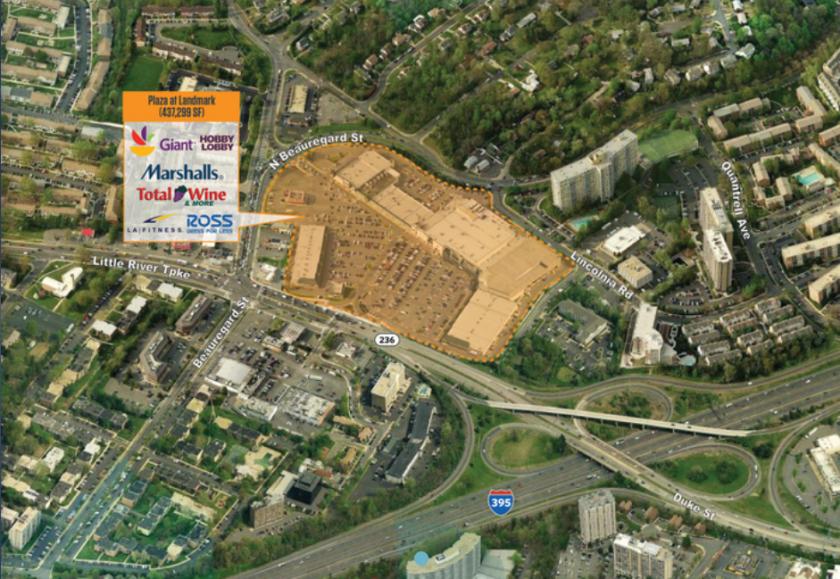
1-Mile | 3-Miles | 5-Miles | ||
---|---|---|---|---|
Total Population | 40,952 | 201,441 | 549,382 | |
Population Median Age | 36 | 38 | 37 | |
Population by Age | 0-9 Yrs | 5349 (13%) | 25649 (12%) | 68667 (12%) |
10-19 Yrs | 3761 (9%) | 18933 (9%) | 53744 (9%) | |
20-29 Yrs | 6721 (16%) | 28306 (14%) | 79874 (14%) | |
30-39 Yrs | 8258 (20%) | 39087 (19%) | 107168 (19%) | |
40-49 Yrs | 5686 (13%) | 29087 (14%) | 77512 (14%) | |
50-59 Yrs | 4934 (12%) | 24645 (12%) | 67282 (12%) | |
60-69 Yrs | 3777 (9%) | 19583 (9%) | 52334 (9%) | |
70+ Yrs | 2466 (6%) | 16151 (8%) | 42801 (7%) | |
Median HH Income | $69,781 | $90,206 | $103,440 | |
Total Household Income | < 24K | 2283 (14%) | 8374 (10%) | 20249 (9%) |
25-49K | 2937 (18%) | 11475 (14%) | 26888 (12%) | |
50-74K | 3468 (21%) | 12867 (16%) | 29553 (13%) | |
75-99K | 2821 (17%) | 11124 (14%) | 28265 (13%) | |
100-199K | 3626 (22%) | 24434 (30%) | 73127 (33%) | |
200K+ | 887 (5%) | 10690 (13%) | 38588 (17%) | |
Highest Education Level | No Diploma | 3305 | 16563 | 41880 |
Diploma or GED | 5715 | 22765 | 55204 | |
Some College | 5562 | 21629 | 50126 | |
Assoc. Degree | 2049 | 9324 | 21254 | |
Bachelors Degree | 6639 | 39715 | 115917 | |
Higher Degree | 5547 | 35422 | 111917 | |
Total Housing Units | 17,591 | 84,476 | 229,366 | |
--Owner-Occupied | 5,098 | 37,700 | 111,526 | |
--Renter-Occupied | 10,924 | 41,264 | 105,143 | |
Owner-Occupied Values | < 100K | 146 | 545 | 1389 |
100-199K | 1142 | 2719 | 5487 | |
200-299K | 1527 | 5190 | 9973 | |
300-399K | 504 | 6158 | 15893 | |
400-499K | 440 | 8210 | 23072 | |
500K+ | 1338 | 14877 | 55712 | |
Total Working Age Population | 33,147 | 164,538 | 447,207 | |
In Work Force | 25,013 | 122,173 | 338,448 | |
Not In Work Force | 8,134 | 42,365 | 108,759 | |
Workforce Employed | 23,452 | 115,113 | 320,112 | |
Workforce Unemployed | 1,175 | 4,780 | 11,565 | |
Civlian Workforce | 24,627 | 119,892 | 331,676 | |
Military Workforce | 386 | 2,281 | 6,772 | |
Total Households | 16,022 | 78,964 | 216,669 | |
Family Households | 8,611 | 44,025 | 122,437 | |
Non-Family Households | 7,411 | 34,939 | 94,232 | |
Married Couple | 5,070 | 31,229 | 93,021 | |
Other Family | 3,541 | 12,796 | 29,416 | |
Married w/Child | 2,416 | 14,416 | 43,134 | |
Single Male w/Child | 311 | 1,271 | 3,052 | |
Single Female w/Child | 1,265 | 4,429 | 10,518 |
Population Change Last Two Decades - Plus Projection
2000 | % | 2010 | % | 2020 | % | 2030 | |
---|---|---|---|---|---|---|---|
District of Columbia | 572,059 | +5 | 601,723 | +21 | 729,501 | +15 | 842,154 |
Maryland | 5,296,486 | +9 | 5,773,552 | +6 | 6,141,900 | +6 | 6,518,750 |
Prince Georges County | 801,515 | +8 | 863,420 | +6 | 916,150 | +4 | 952,950 |
Virginia | 7,078,515 | +13 | 8,001,024 | +8 | 8,655,021 | +8 | 9,331,666 |
Arlington County | 189,453 | +10 | 207,627 | +20 | 249,298 | +10 | 274,339 |
Fairfax County | 969,749 | +12 | 1,081,726 | +7 | 1,162,504 | +7 | 1,244,025 |
Prince William County | 280,813 | +43 | 402,002 | +19 | 478,134 | +20 | 571,844 |
Alexandria city | 128,283 | +9 | 139,966 | +19 | 166,261 | +10 | 182,067 |
Falls Church city | 10,377 | +19 | 12,332 | +22 | 14,988 | +14 | 17,032 |
Total Working Age Population:
Total Households:
Total Working Age Population:
Total Households:
Total Working Age Population:
Total Households: