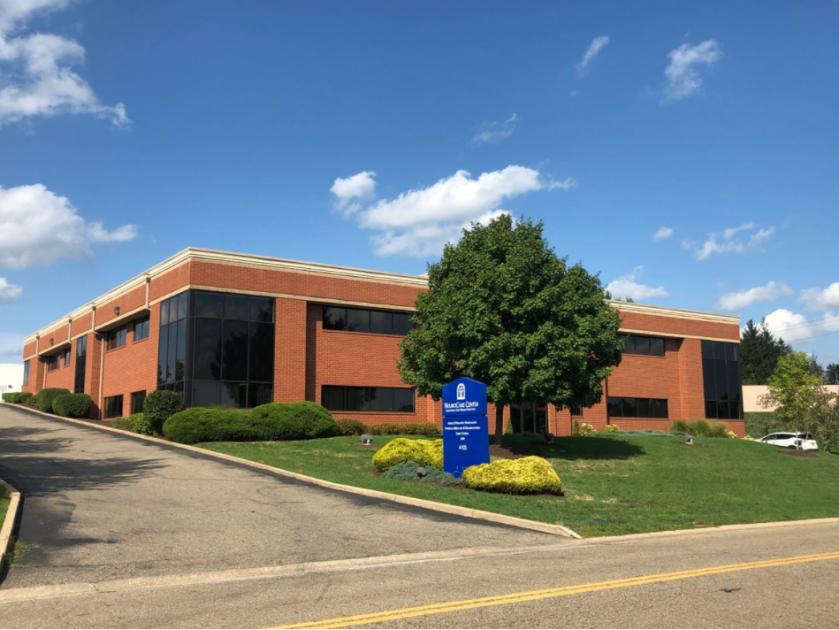
Office Space
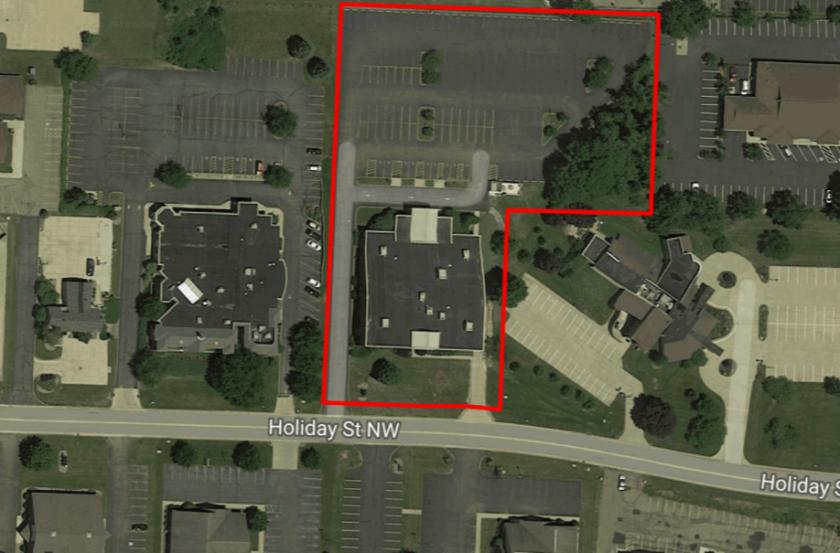
4105 Holiday Street Northwest Canton, OH 44718
4105 Holiday Street Northwest Canton, OH 44718
Details & Description
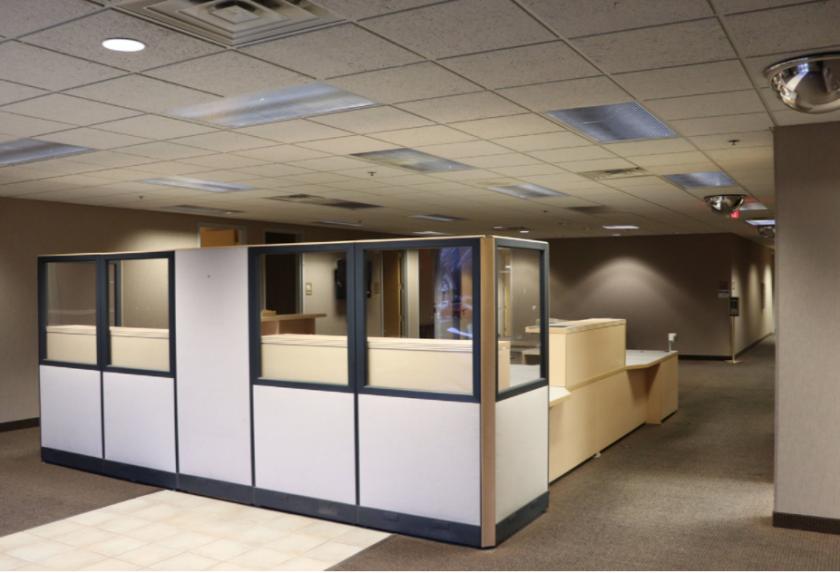
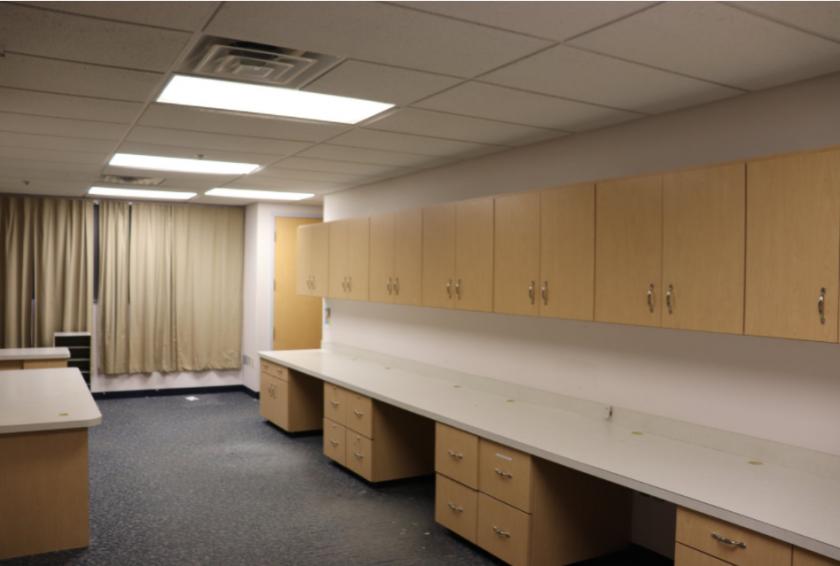
Additional Photos
Listing Agents

Dan Spring
O: 330-497-6249
M: 330-495-4815
dan@naispring.com
O: 330-497-6249
M: 330-495-4815
dan@naispring.com

Kelly Sober
O: 330-497-9837
M: 330-806-8140
kelly@naispring.com
O: 330-497-9837
M: 330-806-8140
kelly@naispring.com

Sean Sanford
O: 330-284-0331
M: 330-284-0331
sean@naispring.com
O: 330-284-0331
M: 330-284-0331
sean@naispring.com
While we strive to provide the most accurate information, all listing information, and demographic data, is provided by third-parties. As such, MyEListing will not be responsible for the accuracy of the information. It is strongly recommended that you verify all information with the listing agent, and any relevant agencies, prior to making any decisions.


