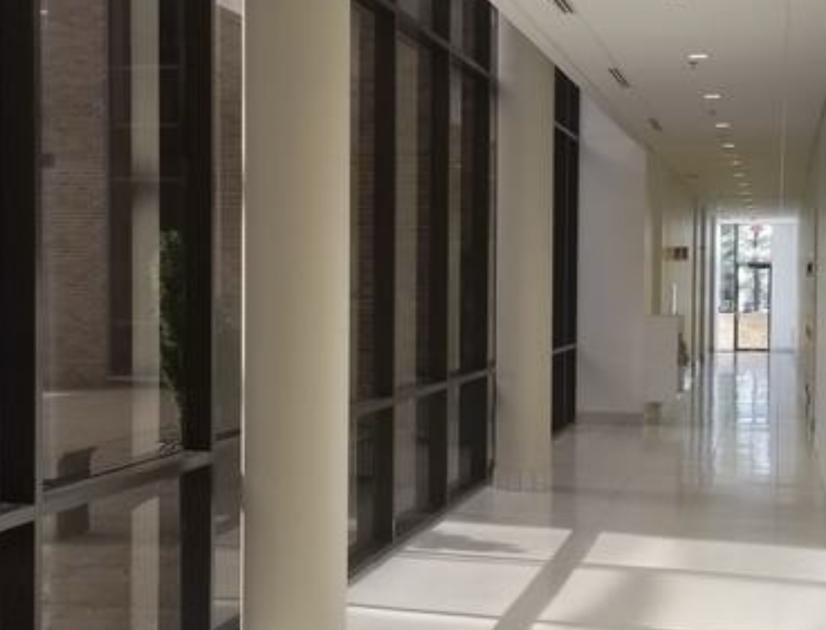
• New Tenant Lounge, Lobby Upgrades and Conference Room complete
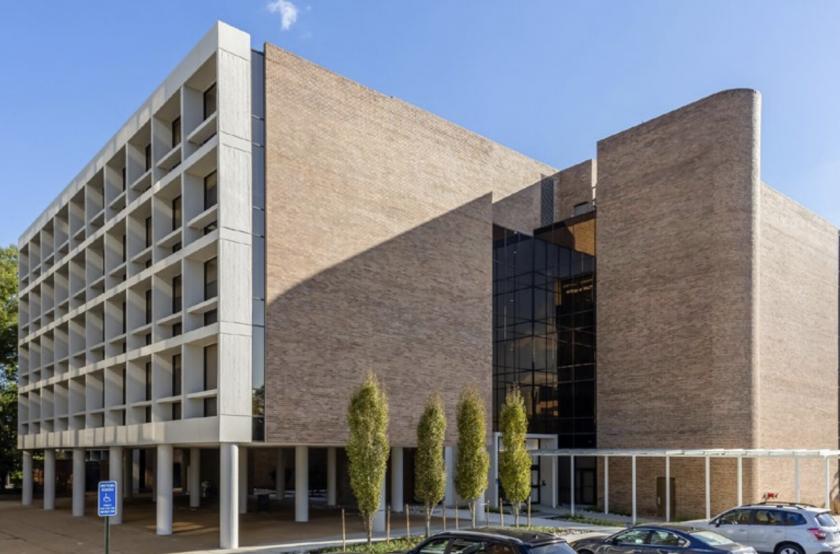
• Additional enhancements to include elevator upgrades, exterior courtyard with seating, and a new canopy to patient drop off area delivering 2nd Q
• Up to 45,646 sf of office space available
• Medical suites as small as 1,500 sf • Great Tysons location - Easy access to Vienna, Merrifield & 495
• Within 1/2 mile to Greensboro Metro Station • Surrounded by an abundance of restaurants and shopping
• 274 surface parking spaces - ratio of 3.2 per 1,000 sf - cross easement overflow parking with neighboring building
• Imaging & Radiology on site (Novant Health)
• Term: 7 - 10 years • Asking Rate: $29.50 - $33.50 net of janitorial
No part of this information may be copied, reproduced, repurposed, or screen-captured for any commercial purpose without prior written authorization from MyEListing.
While we strive to provide the most accurate information, all listing information, and demographic data, is provided by third-parties. As such, MyEListing will not be responsible for the accuracy of the information. It is strongly recommended that you verify all information with the listing agent, and any relevant agencies, prior to making any decisions.
What is the asking price for 8320 Old Courthouse Road in Vienna?
The asking price for 8320 Old Courthouse Road is $29.50 - $33.50 a SF per Year
What is the building size of this commercial Office property?
The size of this multi-unit property varies between 1500 - 45646 square feet
What kind of Office is the propery at 8320 Old Courthouse Road?
The property at 8320 Old Courthouse Road Vienna, VA 22182 is listed as a Professional Office property
What is the population within 1 mile of 8320 Old Courthouse Road in Vienna?
The population within 1 mile of 8320 Old Courthouse Road Vienna, VA 22182 is 13,477 people.
Who do I contact for questions about 8320 Old Courthouse Road?
You should contact the listing agent,
Marc Tasker, for any details regarding this commercial listing.