Industrial Properties
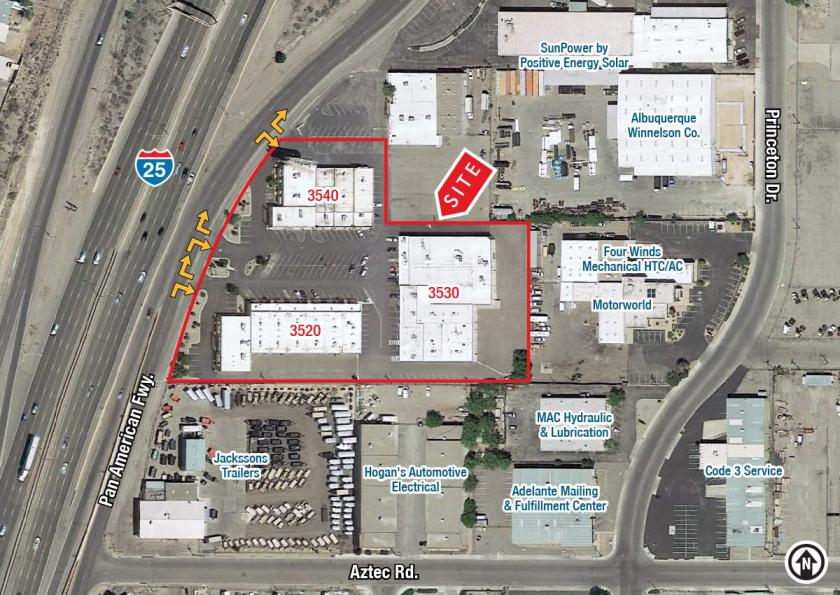
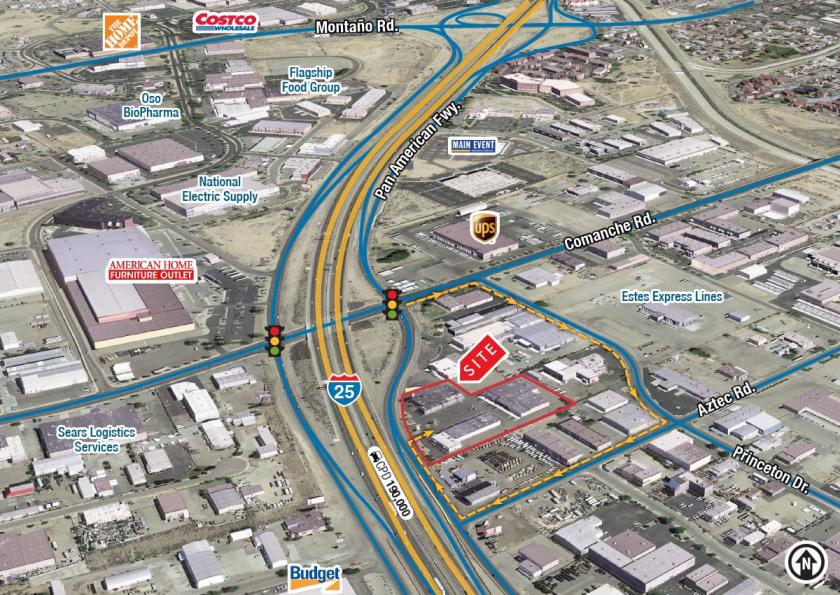
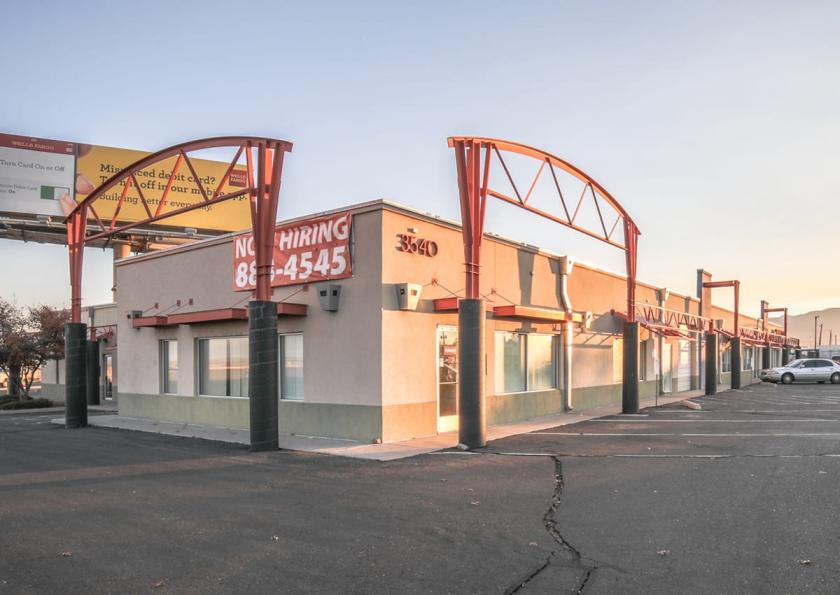
3520 Pan American Freeway Northeast Albuquerque, NM 87107
3520 Pan American Freeway Northeast Albuquerque, NM 87107
Details & Description
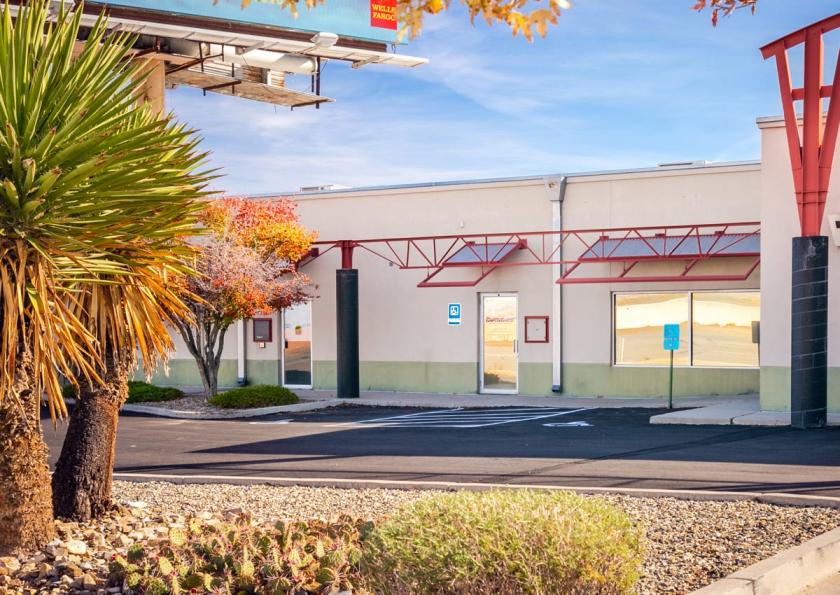
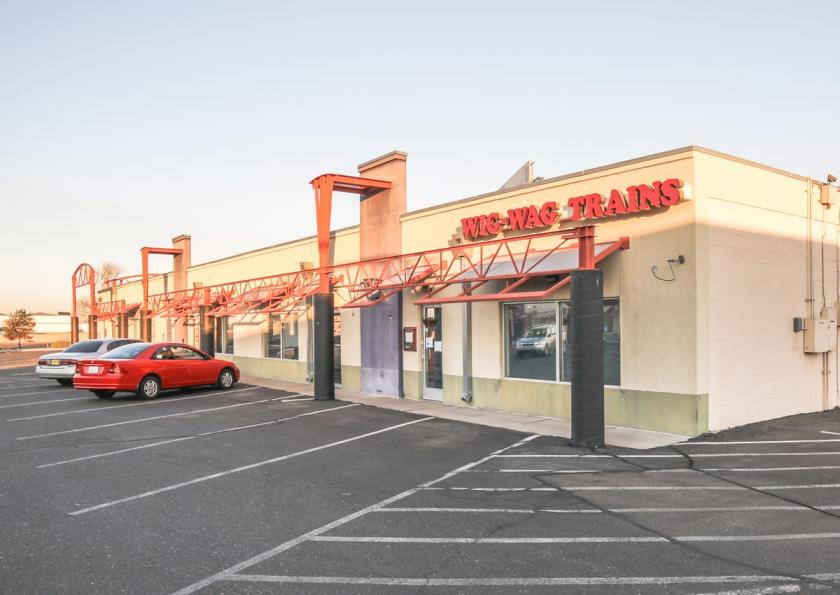
Additional Photos

Listing Agents

Keith Meyer
O: 505-878-0009
M: 505-715-3228
keithmeyer@sunvista.com
O: 505-878-0009
M: 505-715-3228
keithmeyer@sunvista.com

Riley McKee
O: 505-998-1656
M: 505-379-1549
riley@sunvista.com
O: 505-998-1656
M: 505-379-1549
riley@sunvista.com

Jim Wible
O: 505-998-1578
M: 505-400-6857
jimw@sunvista.com
O: 505-998-1578
M: 505-400-6857
jimw@sunvista.com
While we strive to provide the most accurate information, all listing information, and demographic data, is provided by third-parties. As such, MyEListing will not be responsible for the accuracy of the information. It is strongly recommended that you verify all information with the listing agent, and any relevant agencies, prior to making any decisions.