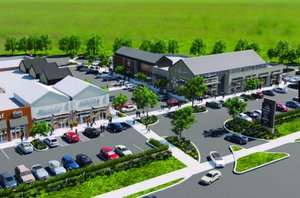
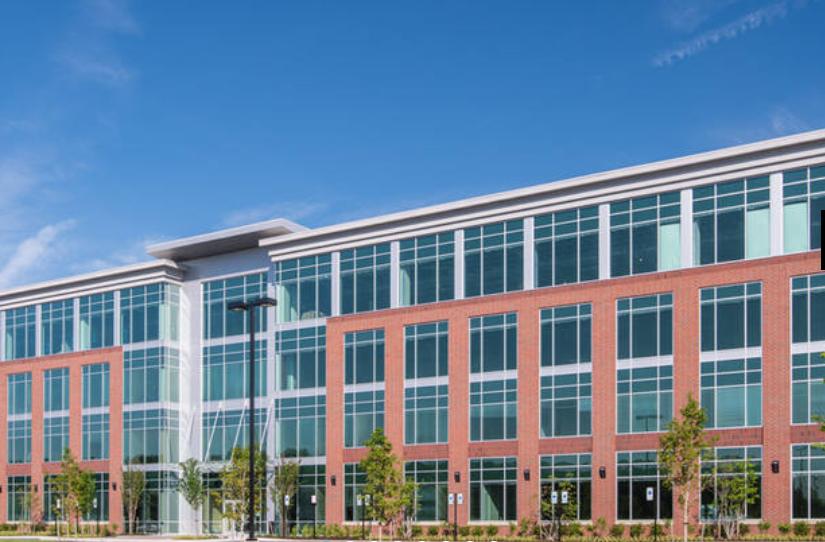
Office Space
8115 Maple Lawn Boulevard Fulton, MD 20759
8115 Maple Lawn Boulevard Fulton, MD 20759
Details & Description
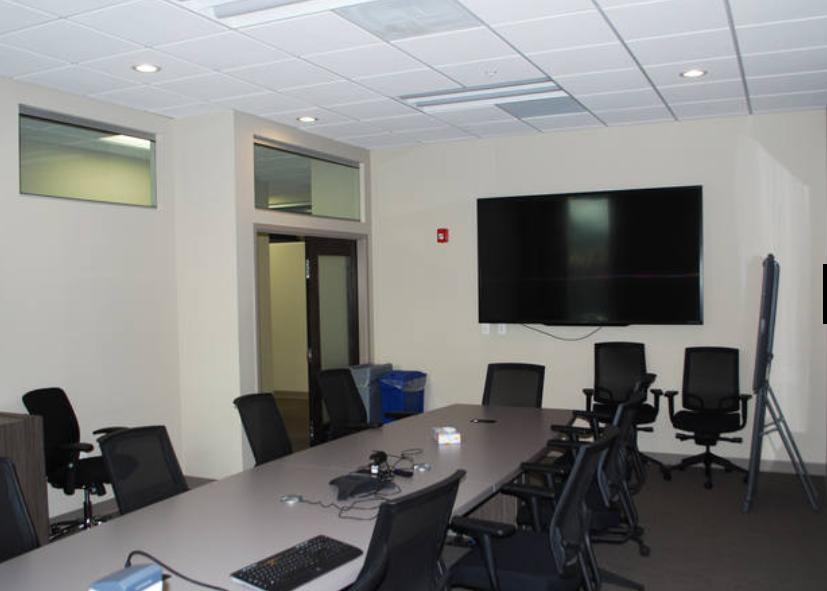
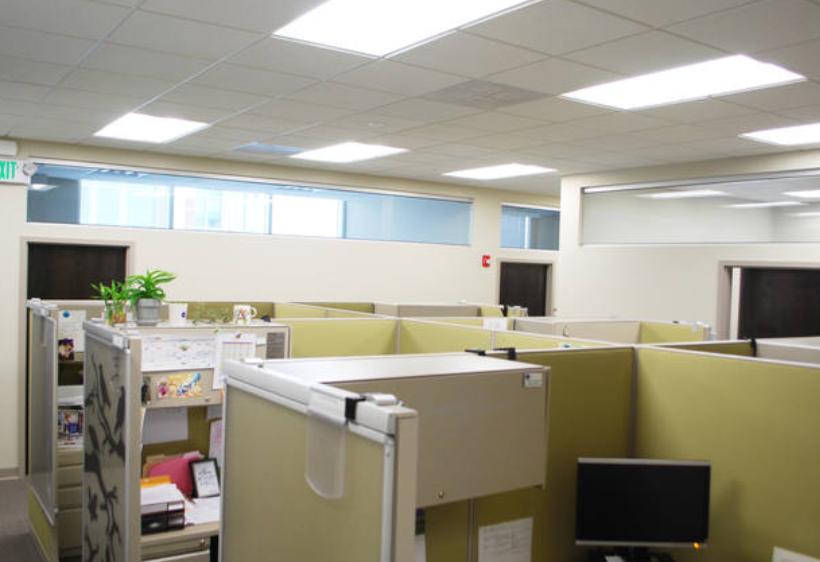
Additional Photos
Listing Agents

Abby Glassberg
O: 443-574-1433
M: 410-952-4446
aglassberg@klnb.com
O: 443-574-1433
M: 410-952-4446
aglassberg@klnb.com

Charles Breitenother
O: 443-574-1422
M: 443-864-6348
cbreitenother@klnb.com
O: 443-574-1422
M: 443-864-6348
cbreitenother@klnb.com
While we strive to provide the most accurate information, all listing information, and demographic data, is provided by third-parties. As such, MyEListing will not be responsible for the accuracy of the information. It is strongly recommended that you verify all information with the listing agent, and any relevant agencies, prior to making any decisions.