Condo Fees: $235 per unit
Class A office space
First floor office/medical condominium building
Real Estate Taxes: $3,105.27 per year
Columbia Association Taxes: $718.64 per year
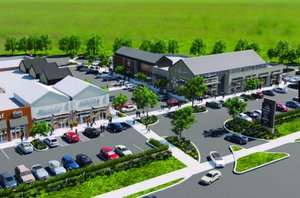
Close proximity to hotels, shopping malls, retail centers and recreational uses
Excellent access to Routes 29, 108, 175 and 100
Potential User/Investment/Executive Suites opportunity
No part of this information may be copied, reproduced, repurposed, or screen-captured for any commercial purpose without prior written authorization from MyEListing.
While we strive to provide the most accurate information, all listing information, and demographic data, is provided by third-parties. As such, MyEListing will not be responsible for the accuracy of the information. It is strongly recommended that you verify all information with the listing agent, and any relevant agencies, prior to making any decisions.
What is the building size of this commercial Office property?
The size of this lease property at '.5022 Dorsey Hall Drive.' is 1084 square feet
What kind of Office is the propery at 5022 Dorsey Hall Drive?
The property at 5022 Dorsey Hall Drive Ellicott City, MD 21042 is listed as a Professional Office property
What is the population within 1 mile of 5022 Dorsey Hall Drive in Ellicott City?
The population within 1 mile of 5022 Dorsey Hall Drive Ellicott City, MD 21042 is 8,726 people.
Who do I contact for questions about 5022 Dorsey Hall Drive?
You should contact the listing agent,
Abby Glassberg, for any details regarding this commercial listing.