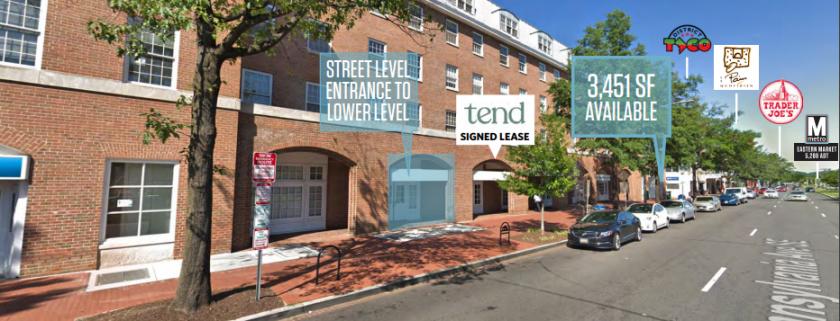
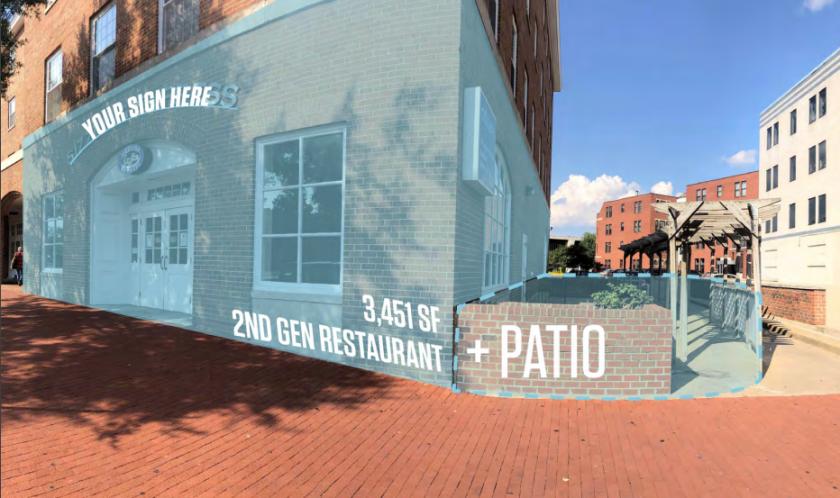
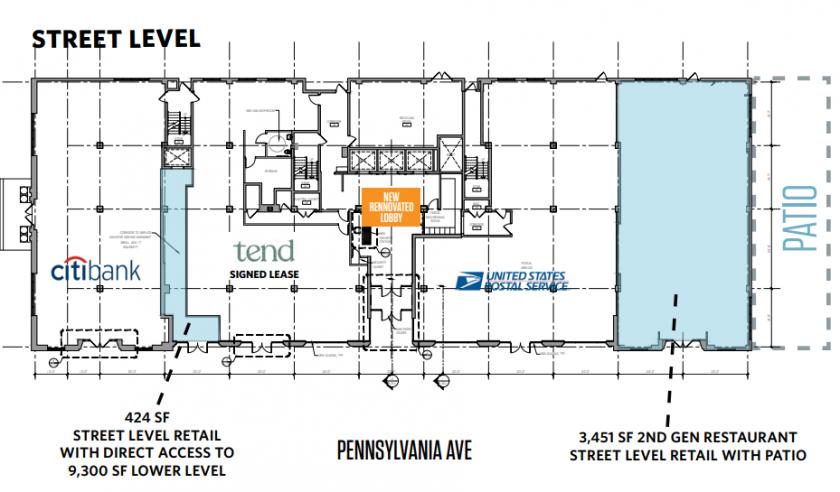
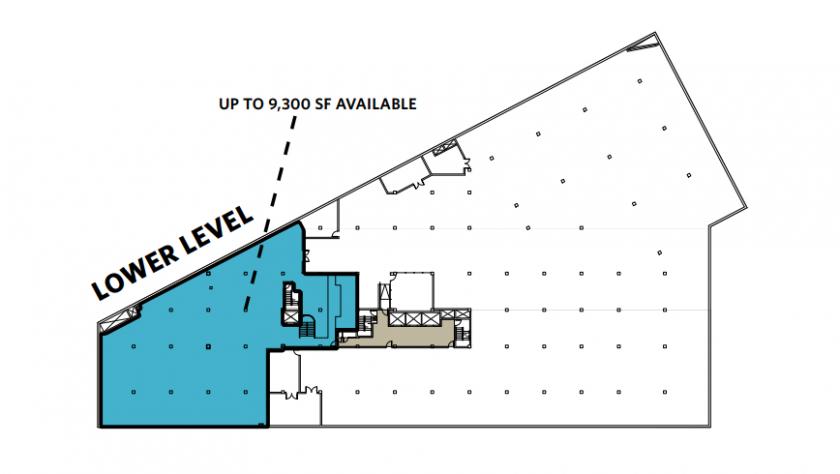
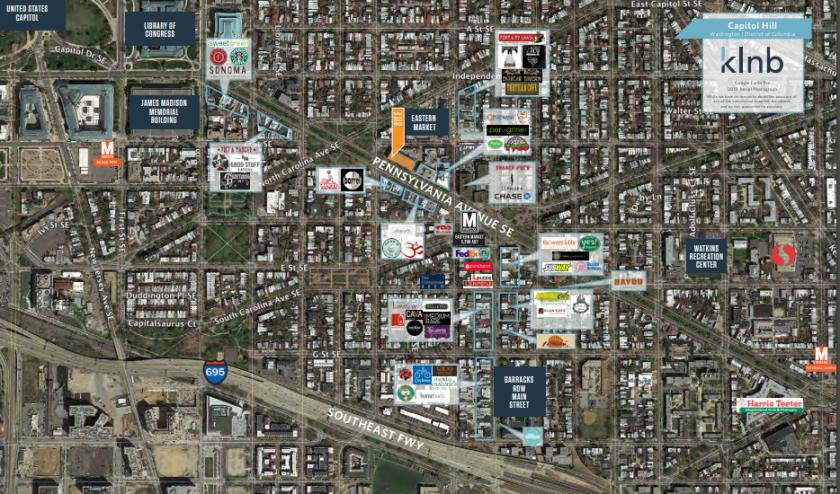
1-Mile | 3-Miles | 5-Miles | ||
---|---|---|---|---|
Total Population | 50,590 | 301,307 | 771,748 | |
Population Median Age | 36 | 36 | 36 | |
Population by Age | 0-9 Yrs | 5999 (11%) | 32821 (10%) | 86853 (11%) |
10-19 Yrs | 2599 (5%) | 26773 (8%) | 69045 (8%) | |
20-29 Yrs | 10041 (19%) | 65950 (21%) | 163094 (21%) | |
30-39 Yrs | 13966 (27%) | 67753 (22%) | 160044 (20%) | |
40-49 Yrs | 6578 (13%) | 34095 (11%) | 90674 (11%) | |
50-59 Yrs | 4329 (8%) | 30642 (10%) | 81858 (10%) | |
60-69 Yrs | 3523 (6%) | 23517 (7%) | 64914 (8%) | |
70+ Yrs | 3556 (7%) | 19755 (6%) | 55266 (7%) | |
Median HH Income | $131,825 | $83,755 | $83,133 | |
Total Household Income | < 24K | 2173 (9%) | 26710 (20%) | 59172 (18%) |
25-49K | 1721 (7%) | 18067 (14%) | 46616 (14%) | |
50-74K | 2064 (9%) | 14842 (11%) | 44505 (13%) | |
75-99K | 2467 (10%) | 13493 (10%) | 38001 (11%) | |
100-199K | 7714 (34%) | 34891 (27%) | 88377 (27%) | |
200K+ | 6500 (28%) | 20686 (16%) | 48643 (14%) | |
Highest Education Level | No Diploma | 1435 | 18673 | 53590 |
Diploma or GED | 2525 | 39741 | 103491 | |
Some College | 2318 | 27213 | 75059 | |
Assoc. Degree | 855 | 6869 | 19384 | |
Bachelors Degree | 14049 | 55672 | 136239 | |
Higher Degree | 18391 | 68656 | 164884 | |
Total Housing Units | 25,062 | 143,606 | 360,878 | |
--Owner-Occupied | 10,591 | 45,154 | 120,395 | |
--Renter-Occupied | 12,048 | 83,534 | 204,920 | |
Owner-Occupied Values | < 100K | 53 | 973 | 3129 |
100-199K | 61 | 1558 | 7246 | |
200-299K | 298 | 4405 | 16959 | |
300-399K | 715 | 6734 | 18502 | |
400-499K | 797 | 5577 | 14577 | |
500K+ | 8666 | 25906 | 59983 | |
Total Working Age Population | 42,981 | 255,119 | 648,535 | |
In Work Force | 34,374 | 179,297 | 469,191 | |
Not In Work Force | 8,608 | 75,822 | 179,344 | |
Workforce Employed | 32,430 | 164,506 | 431,474 | |
Workforce Unemployed | 1,267 | 12,469 | 30,840 | |
Civlian Workforce | 33,697 | 176,975 | 462,315 | |
Military Workforce | 676 | 2,322 | 6,876 | |
Total Households | 22,639 | 128,688 | 325,315 | |
Family Households | 9,828 | 50,346 | 137,879 | |
Non-Family Households | 12,811 | 78,342 | 187,435 | |
Married Couple | 8,129 | 28,019 | 79,623 | |
Other Family | 1,700 | 22,327 | 58,256 | |
Married w/Child | 3,184 | 9,133 | 27,843 | |
Single Male w/Child | 159 | 1,486 | 4,637 | |
Single Female w/Child | 492 | 9,632 | 23,231 |
Population Change Last Two Decades - Plus Projection
2000 | % | 2010 | % | 2020 | % | 2030 | |
---|---|---|---|---|---|---|---|
District of Columbia | 572,059 | +5 | 601,723 | +21 | 729,501 | +15 | 842,154 |
Maryland | 5,296,486 | +9 | 5,773,552 | +6 | 6,141,900 | +6 | 6,518,750 |
Montgomery County | 873,341 | +11 | 971,777 | +8 | 1,052,050 | +7 | 1,128,800 |
Prince Georges County | 801,515 | +8 | 863,420 | +6 | 916,150 | +4 | 952,950 |
Virginia | 7,078,515 | +13 | 8,001,024 | +8 | 8,655,021 | +8 | 9,331,666 |
Arlington County | 189,453 | +10 | 207,627 | +20 | 249,298 | +10 | 274,339 |
Fairfax County | 969,749 | +12 | 1,081,726 | +7 | 1,162,504 | +7 | 1,244,025 |
Alexandria city | 128,283 | +9 | 139,966 | +19 | 166,261 | +10 | 182,067 |
Total Working Age Population:
Total Households:
Total Working Age Population:
Total Households:
Total Working Age Population:
Total Households: