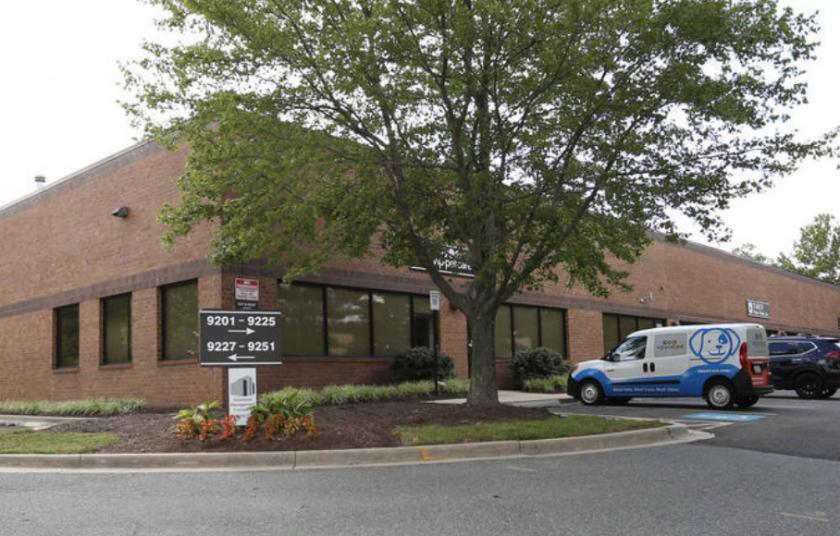
1-Mile | 3-Miles | 5-Miles | ||
---|---|---|---|---|
Total Population | 8,366 | 87,458 | 252,666 | |
Population Median Age | 38 | 39 | 38 | |
Population by Age | 0-9 Yrs | 1143 (13%) | 10852 (12%) | 33527 (13%) |
10-19 Yrs | 704 (8%) | 10071 (11%) | 29851 (11%) | |
20-29 Yrs | 1127 (13%) | 11340 (12%) | 34572 (13%) | |
30-39 Yrs | 1469 (17%) | 12502 (14%) | 35021 (13%) | |
40-49 Yrs | 1046 (12%) | 11106 (12%) | 32504 (12%) | |
50-59 Yrs | 1248 (14%) | 12524 (14%) | 35825 (14%) | |
60-69 Yrs | 1111 (13%) | 11072 (12%) | 29526 (11%) | |
70+ Yrs | 518 (6%) | 7991 (9%) | 21840 (8%) | |
Median HH Income | $86,104 | $84,300 | $76,043 | |
Total Household Income | < 24K | 272 (7%) | 3454 (10%) | 13104 (14%) |
25-49K | 545 (15%) | 4903 (15%) | 15273 (16%) | |
50-74K | 631 (18%) | 5712 (17%) | 16982 (18%) | |
75-99K | 679 (19%) | 5855 (18%) | 13784 (15%) | |
100-199K | 1228 (35%) | 10182 (31%) | 25743 (28%) | |
200K+ | 144 (4%) | 2388 (7%) | 6984 (7%) | |
Highest Education Level | No Diploma | 288 | 5140 | 18776 |
Diploma or GED | 1541 | 17901 | 54371 | |
Some College | 1494 | 14553 | 40496 | |
Assoc. Degree | 463 | 3622 | 10332 | |
Bachelors Degree | 1558 | 11477 | 28392 | |
Higher Degree | 817 | 8903 | 21274 | |
Total Housing Units | 3,912 | 34,950 | 99,247 | |
--Owner-Occupied | 1,678 | 21,494 | 57,446 | |
--Renter-Occupied | 1,822 | 11,000 | 34,424 | |
Owner-Occupied Values | < 100K | 212 | 1245 | 2665 |
100-199K | 364 | 4126 | 10639 | |
200-299K | 632 | 8281 | 20666 | |
300-399K | 357 | 5040 | 14145 | |
400-499K | 68 | 1758 | 5543 | |
500K+ | 45 | 1044 | 3788 | |
Total Working Age Population | 6,774 | 70,460 | 200,921 | |
In Work Force | 5,183 | 49,863 | 140,847 | |
Not In Work Force | 1,592 | 20,597 | 60,074 | |
Workforce Employed | 4,846 | 46,355 | 129,588 | |
Workforce Unemployed | 285 | 3,330 | 10,960 | |
Civlian Workforce | 5,131 | 49,684 | 140,547 | |
Military Workforce | 52 | 179 | 300 | |
Total Households | 3,500 | 32,494 | 91,870 | |
Family Households | 1,852 | 20,344 | 57,961 | |
Non-Family Households | 1,647 | 12,150 | 33,909 | |
Married Couple | 910 | 10,278 | 29,338 | |
Other Family | 942 | 10,066 | 28,623 | |
Married w/Child | 352 | 3,530 | 10,632 | |
Single Male w/Child | 43 | 722 | 2,194 | |
Single Female w/Child | 353 | 3,576 | 10,096 |
Population Change Last Two Decades - Plus Projection
2000 | % | 2010 | % | 2020 | % | 2030 | |
---|---|---|---|---|---|---|---|
District of Columbia | 572,059 | +5 | 601,723 | +21 | 729,501 | +15 | 842,154 |
Maryland | 5,296,486 | +9 | 5,773,552 | +6 | 6,141,900 | +6 | 6,518,750 |
Anne Arundel County | 489,656 | +10 | 537,656 | +7 | 573,250 | +4 | 596,700 |
Montgomery County | 873,341 | +11 | 971,777 | +8 | 1,052,050 | +7 | 1,128,800 |
Prince Georges County | 801,515 | +8 | 863,420 | +6 | 916,150 | +4 | 952,950 |
Total Working Age Population:
Total Households:
Total Working Age Population:
Total Households:
Total Working Age Population:
Total Households: