Total Contiguous Space: 7,856 square feet
Suite 400: 6,317 square feet
Suite 403: 1,539 square feet
Price: $2,250,000 for the contiguous space
Taxes: $3,255.78 per month
Condo Fees: $1,933 per month
Exterior corner balcony
Four (4) storage cages in the basement
Three (3) reserved parking spaces
Access to Route 29, Route 175 and I-95
No part of this information may be copied, reproduced, repurposed, or screen-captured for any commercial purpose without prior written authorization from MyEListing.
While we strive to provide the most accurate information, all listing information, and demographic data, is provided by third-parties. As such, MyEListing will not be responsible for the accuracy of the information. It is strongly recommended that you verify all information with the listing agent, and any relevant agencies, prior to making any decisions.
What is the building size of this commercial Office property?
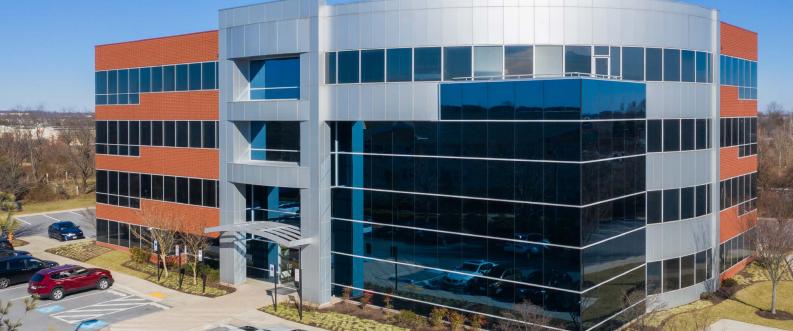
The size of this lease property at '.8894 Stanford Boulevard.' is 1539 square feet
What kind of Office is the propery at 8894 Stanford Boulevard?
The property at 8894 Stanford Boulevard Columbia, MD 21045 is listed as a Professional Office property
What is the population within 1 mile of 8894 Stanford Boulevard in Columbia?
The population within 1 mile of 8894 Stanford Boulevard Columbia, MD 21045 is 8,803 people.
Who do I contact for questions about 8894 Stanford Boulevard?
You should contact the listing agent,
Charles Breitenother, for any details regarding this commercial listing.