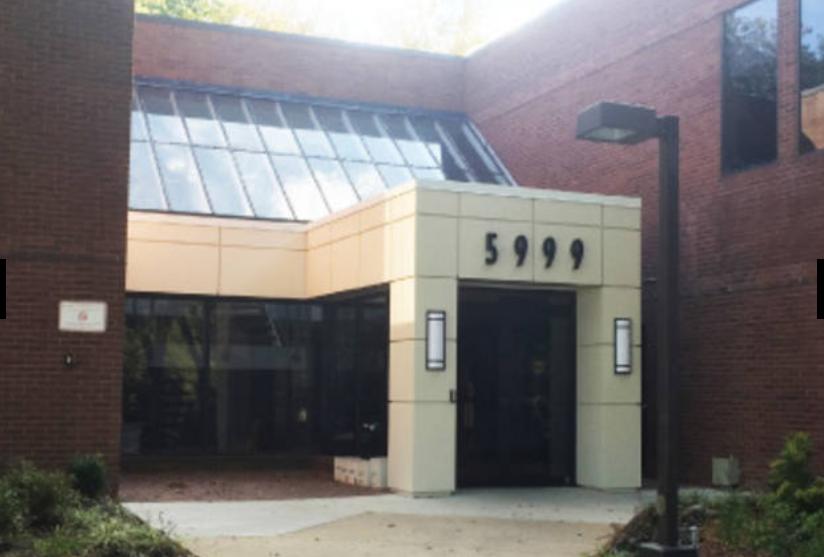
1-Mile | 3-Miles | 5-Miles | ||
---|---|---|---|---|
Total Population | 16,581 | 77,423 | 163,153 | |
Population Median Age | 39 | 39 | 39 | |
Population by Age | 0-9 Yrs | 1734 (10%) | 8857 (11%) | 19313 (11%) |
10-19 Yrs | 2174 (13%) | 10172 (13%) | 22595 (13%) | |
20-29 Yrs | 2374 (14%) | 9991 (12%) | 19135 (11%) | |
30-39 Yrs | 2356 (14%) | 10108 (13%) | 20790 (12%) | |
40-49 Yrs | 2143 (12%) | 10423 (13%) | 23745 (14%) | |
50-59 Yrs | 2250 (13%) | 10664 (13%) | 23597 (14%) | |
60-69 Yrs | 1625 (9%) | 8652 (11%) | 18392 (11%) | |
70+ Yrs | 1926 (11%) | 8555 (11%) | 15587 (9%) | |
Median HH Income | $92,538 | $112,137 | $121,654 | |
Total Household Income | < 24K | 1075 (15%) | 2657 (8%) | 4883 (8%) |
25-49K | 826 (12%) | 2674 (9%) | 4845 (7%) | |
50-74K | 827 (12%) | 3479 (11%) | 6592 (10%) | |
75-99K | 1006 (14%) | 4328 (14%) | 7838 (12%) | |
100-199K | 2399 (34%) | 10783 (36%) | 22676 (37%) | |
200K+ | 734 (10%) | 5787 (19%) | 13746 (22%) | |
Highest Education Level | No Diploma | 625 | 2459 | 4549 |
Diploma or GED | 1729 | 6548 | 13029 | |
Some College | 1717 | 7519 | 15295 | |
Assoc. Degree | 583 | 2976 | 6077 | |
Bachelors Degree | 3571 | 17303 | 35225 | |
Higher Degree | 3315 | 17141 | 37763 | |
Total Housing Units | 7,365 | 31,345 | 63,478 | |
--Owner-Occupied | 3,821 | 19,768 | 43,699 | |
--Renter-Occupied | 3,047 | 9,939 | 16,881 | |
Owner-Occupied Values | < 100K | 147 | 456 | 899 |
100-199K | 380 | 1172 | 2176 | |
200-299K | 1190 | 3128 | 6080 | |
300-399K | 949 | 5049 | 9822 | |
400-499K | 623 | 3787 | 8038 | |
500K+ | 531 | 6176 | 16685 | |
Total Working Age Population | 13,557 | 62,458 | 129,714 | |
In Work Force | 9,825 | 44,269 | 92,671 | |
Not In Work Force | 3,732 | 18,190 | 37,043 | |
Workforce Employed | 9,258 | 42,105 | 88,241 | |
Workforce Unemployed | 414 | 1,669 | 3,538 | |
Civlian Workforce | 9,672 | 43,774 | 91,779 | |
Military Workforce | 153 | 494 | 892 | |
Total Households | 6,868 | 29,707 | 60,580 | |
Family Households | 4,247 | 20,194 | 42,972 | |
Non-Family Households | 2,621 | 9,513 | 17,609 | |
Married Couple | 2,592 | 15,256 | 33,765 | |
Other Family | 1,654 | 4,938 | 9,207 | |
Married w/Child | 892 | 6,193 | 15,321 | |
Single Male w/Child | 58 | 467 | 953 | |
Single Female w/Child | 840 | 2,035 | 3,640 |
Population Change Last Two Decades - Plus Projection
2000 | % | 2010 | % | 2020 | % | 2030 | |
---|---|---|---|---|---|---|---|
Maryland | 5,296,486 | +9 | 5,773,552 | +6 | 6,141,900 | +6 | 6,518,750 |
Anne Arundel County | 489,656 | +10 | 537,656 | +7 | 573,250 | +4 | 596,700 |
Baltimore County | 754,292 | +7 | 805,029 | +5 | 847,000 | +2 | 862,200 |
Howard County | 247,842 | +16 | 287,085 | +17 | 336,900 | +9 | 366,800 |
Montgomery County | 873,341 | +11 | 971,777 | +8 | 1,052,050 | +7 | 1,128,800 |
Total Working Age Population:
Total Households:
Total Working Age Population:
Total Households:
Total Working Age Population:
Total Households: