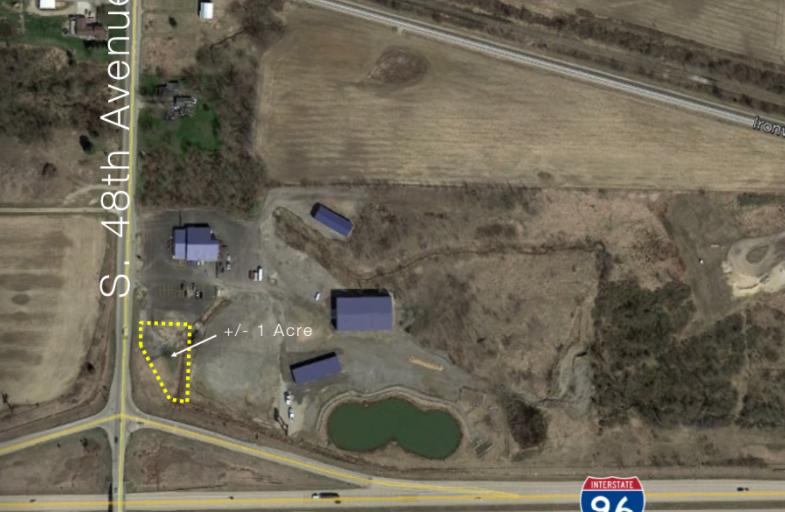
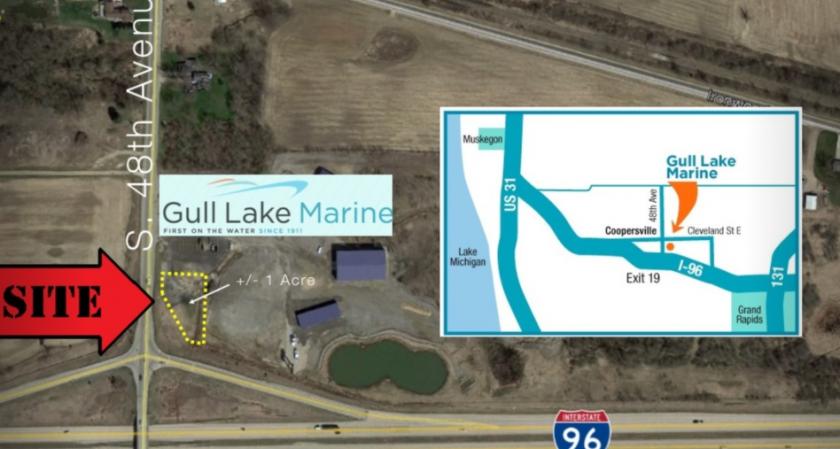
1-Mile | 3-Miles | 5-Miles | ||
---|---|---|---|---|
Total Population | 947 | 6,488 | 13,969 | |
Population Median Age | 35 | 35 | 36 | |
Population by Age | 0-9 Yrs | 147 (15%) | 979 (15%) | 2004 (14%) |
10-19 Yrs | 145 (15%) | 968 (14%) | 2065 (14%) | |
20-29 Yrs | 151 (15%) | 1008 (15%) | 2115 (15%) | |
30-39 Yrs | 138 (14%) | 915 (14%) | 1821 (13%) | |
40-49 Yrs | 101 (10%) | 701 (10%) | 1562 (11%) | |
50-59 Yrs | 103 (10%) | 760 (11%) | 1732 (12%) | |
60-69 Yrs | 78 (8%) | 572 (8%) | 1381 (9%) | |
70+ Yrs | 83 (8%) | 585 (9%) | 1290 (9%) | |
Median HH Income | $61,413 | $64,687 | $68,241 | |
Total Household Income | < 24K | 57 (16%) | 368 (16%) | 681 (13%) |
25-49K | 73 (21%) | 461 (20%) | 1018 (20%) | |
50-74K | 77 (22%) | 511 (22%) | 1055 (21%) | |
75-99K | 52 (15%) | 356 (15%) | 694 (14%) | |
100-199K | 71 (21%) | 535 (23%) | 1299 (26%) | |
200K+ | 6 (1%) | 62 (2%) | 192 (3%) | |
Highest Education Level | No Diploma | 43 | 279 | 536 |
Diploma or GED | 214 | 1470 | 3120 | |
Some College | 141 | 928 | 1956 | |
Assoc. Degree | 65 | 440 | 907 | |
Bachelors Degree | 84 | 637 | 1541 | |
Higher Degree | 33 | 259 | 634 | |
Total Housing Units | 351 | 2,381 | 5,104 | |
--Owner-Occupied | 264 | 1,875 | 4,061 | |
--Renter-Occupied | 72 | 418 | 878 | |
Owner-Occupied Values | < 100K | 74 | 441 | 634 |
100-199K | 123 | 823 | 1712 | |
200-299K | 43 | 359 | 959 | |
300-399K | 12 | 129 | 439 | |
400-499K | 6 | 70 | 181 | |
500K+ | 6 | 54 | 138 | |
Total Working Age Population | 697 | 4,841 | 10,719 | |
In Work Force | 489 | 3,394 | 7,538 | |
Not In Work Force | 208 | 1,447 | 3,181 | |
Workforce Employed | 463 | 3,229 | 7,256 | |
Workforce Unemployed | 26 | 164 | 278 | |
Civlian Workforce | 489 | 3,393 | 7,534 | |
Military Workforce | 0 | 1 | 4 | |
Total Households | 336 | 2,293 | 4,939 | |
Family Households | 243 | 1,703 | 3,715 | |
Non-Family Households | 93 | 590 | 1,224 | |
Married Couple | 189 | 1,349 | 3,033 | |
Other Family | 55 | 354 | 682 | |
Married w/Child | 93 | 658 | 1,416 | |
Single Male w/Child | 6 | 39 | 95 | |
Single Female w/Child | 29 | 172 | 265 |
Population Change Last Two Decades - Plus Projection
2000 | % | 2010 | % | 2020 | % | 2030 | |
---|---|---|---|---|---|---|---|
Michigan | 9,938,444 | -1 | 9,883,640 | +1 | 10,023,423 | +4 | 10,424,510 |
Muskegon County | 170,200 | +1 | 172,188 | +2 | 175,323 | +4 | 182,278 |
Ottawa County | 238,314 | +11 | 263,801 | +12 | 295,791 | +12 | 331,723 |
Total Working Age Population:
Total Households:
Total Working Age Population:
Total Households:
Total Working Age Population:
Total Households: