Industrial Properties
8505 Piedmont Industrial Park Drive Southwest Byron Center, MI 49315
8505 Piedmont Industrial Park Drive Southwest Byron Center, MI 49315
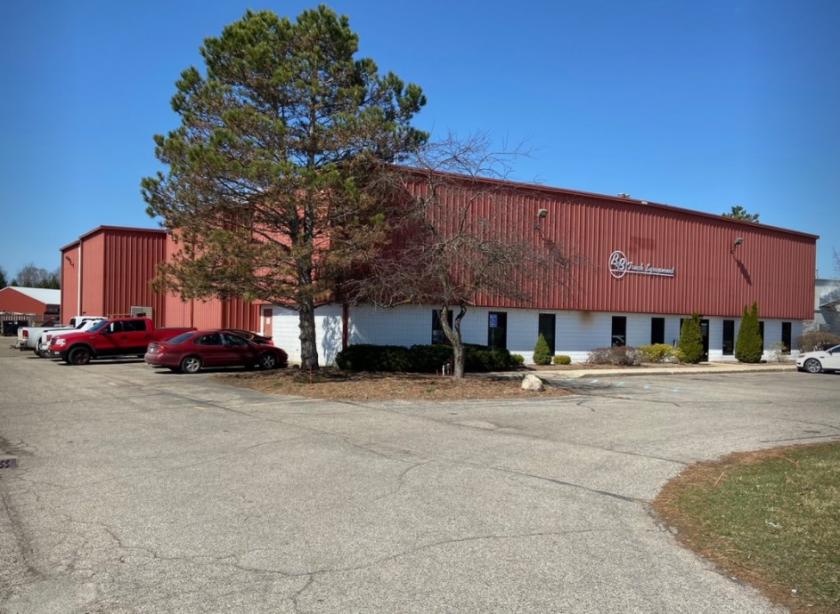
Details & Description
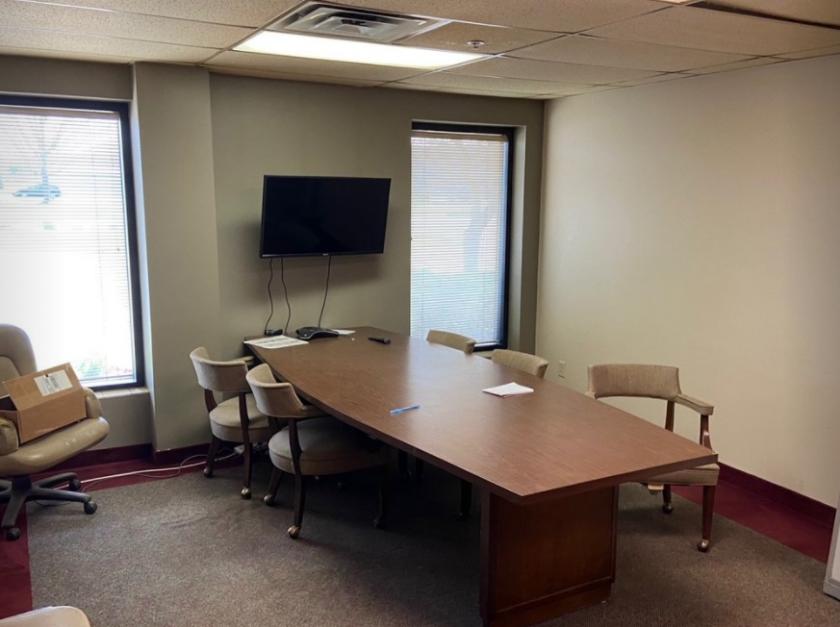
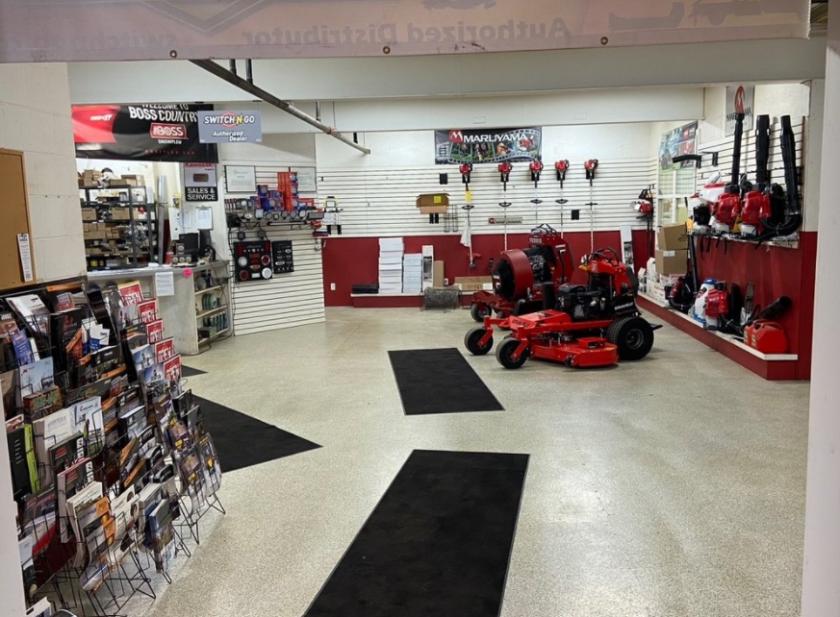
Additional Photos


Listing Agents

Chadwick Versluis
O: 616-242-1125
M: 616-292-6710
chadv@naiwwm.com
O: 616-242-1125
M: 616-292-6710
chadv@naiwwm.com
While we strive to provide the most accurate information, all listing information, and demographic data, is provided by third-parties. As such, MyEListing will not be responsible for the accuracy of the information. It is strongly recommended that you verify all information with the listing agent, and any relevant agencies, prior to making any decisions.


